|
The MEDM/SMAST/UMASSD has developed a lower trophic level food web model was developed for the study of the spring bloom dynamics in the GoM/GB region (Ji, 2003). This is a 9-compartment nutrients-phytoplankton-zooplankton-detritus (NPZD) model including 3 nutrients (nitrate, ammonia and silicate), 2 phytoplankton (large and small size groups), 2 zooplankton (large and small size groups), 1 detrital organic nitrogen component and 1 detrital organic silicon component. The schematic of the model is given in Fig.1. As an extension of our previous NPZ model, this NPZD model was designed to resolve the seasonal pattern of the phytoplankton, while understanding the limitations of this model in capturing the zooplankton dynamics that are linked directly to population dynamics.
|
This NPZD model has been coupled into FVCOM and an offline version is being developed to optimize the use of the FVCOM model output for process-oriented study of the seasonal variability of the plankton dynamics in the GoM/GB. In Ji’s Ph. D thesis research, he has applied the 1-D, 2-D and 3-D versions of the NPZD to examine the spring bloom dynamics on GB (Ji, 2003). Some of his model results are posted here as examples.
|
|
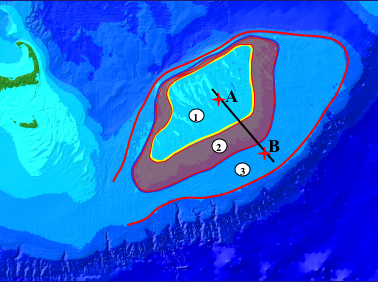
The experiment results show that the controlling mechanism for spring bloom dynamics differs between the central bank and the flank area. In the shallow, well-mixed central bank (bright blue area), the timing and duration of the spring bloom are determined by light intensity and its downward penetration, while the bloom intensity is regulated by initial nutrient concentration and zooplankton grazing pressure. In deeper water (> 60 m) (dark blue area), given the same condition of light intensity/attenuation, initial nutrient concentration and zooplankton grazing pressure as those in the shallow, well-mixed region, the timing of the spring bloom is closely linked to the seasonal development of stratification.
|

Click here or images to view the full size of the image.
|
|
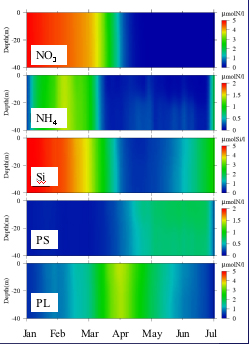
The 1-D model captures the basic seasonal pattern of the nutrients and phytoplankton dynamics in the shallow, well-mixed central bank, but not in the deep flank area, suggesting that frontal dynamics and advective processes have significant impacts on the phytoplankton dynamics in the seasonal stratified region of GB.
|
 |
|
|
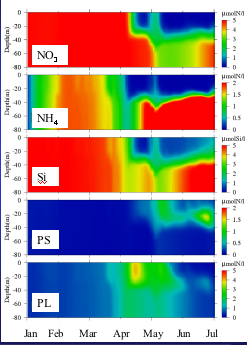
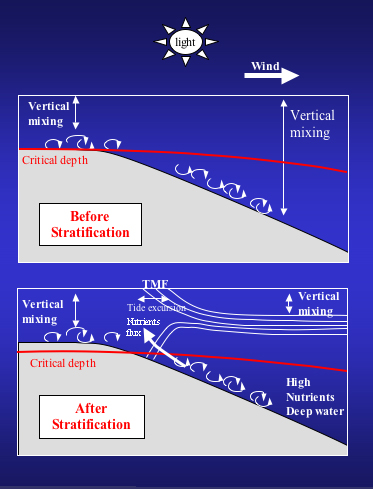
The experiment results show a similar control mechanism for spring bloom dynamics in the central bank and the deep flank area as in the 1-D model experiments, except for the area between shallow and deep region. In this transition area, the phytoplankton maximum is observed in the model due to light availability and continuous nutrient support from the nutrient rich off-bank water through the tidal mixing process before stratification develops. Once the tidal mixing front is established, the “second” bloom occurs as a result of the up-front nutrient flux driven by the secondary flow. The development of spring bloom in the deep flank area is sensitive to the development of stratification, especially during the transition time between vertical mixing and stratification, which usually occurs in later April or early May.
Click here or image on the right to view the full size of the schematic figure.
|
|
An animation showing the temporal variability of nutrients (NO3 and Si), phytoplankton (Ps and PL) and zooplankton (Zs) on the southern flank of Georges Bank. The 2-D model was built by modifying the 2D model developed by Chen et al. (1995) and Franks and Chen (1996). This simple idealized coupled biological and physical model does show the development of spring bloom in mixed region and second summer bloom at tidal mixing frontal zone.
Click here or image on the right to view the animation. |
|
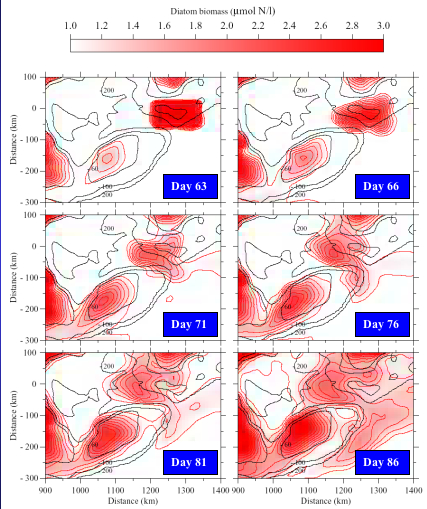
Process-oriented modeling experiments for the 1999 March bloom event on the southeastern flank of GB show that the formation of the phytoplankton bloom in that area during March 1999 is related to 1) transport of the Scotian Shelf Water, 2) wind- and tidal-induced vertical mixing and surface cooling, and 3) the location of the salinity front. With sufficient nutrients supplies from the slope, the bloom can be the result of in situ growth of phytoplankton near the slope where the stability salinity front is located. The model results suggest that an accurate simulation of the spatial distribution of temperature and salinity on GB, as well as the flow field across the Northeast Channel is a prerequisite for modeling the spring bloom on GB.
|
|
NPZD model was run by specifying a source of phytoplankton on Scotian Shelf closed to Northeast Channel (NEC). The model shows that the phytoplankton patch was advected across the NEC and then grew up on their journey along the southern flank. This pattern is very similar to those observed in the distribution of the satellite-derived Chl-a concentration.
Click here or image on the second column to see the time series of the phytoplnakton patch during the simulation period. |
|
|
A particle tracking experiment was made to identify the contribution of the crossover advection to the accumulation of the phytoplankton on the southern slope of Georges Bank.
Click here or image on the right to view the animation of particle tracking.
|
|
|