 |
JIAOZHOU BAY ECOSYSTEM MODELING STUDY
|
| |
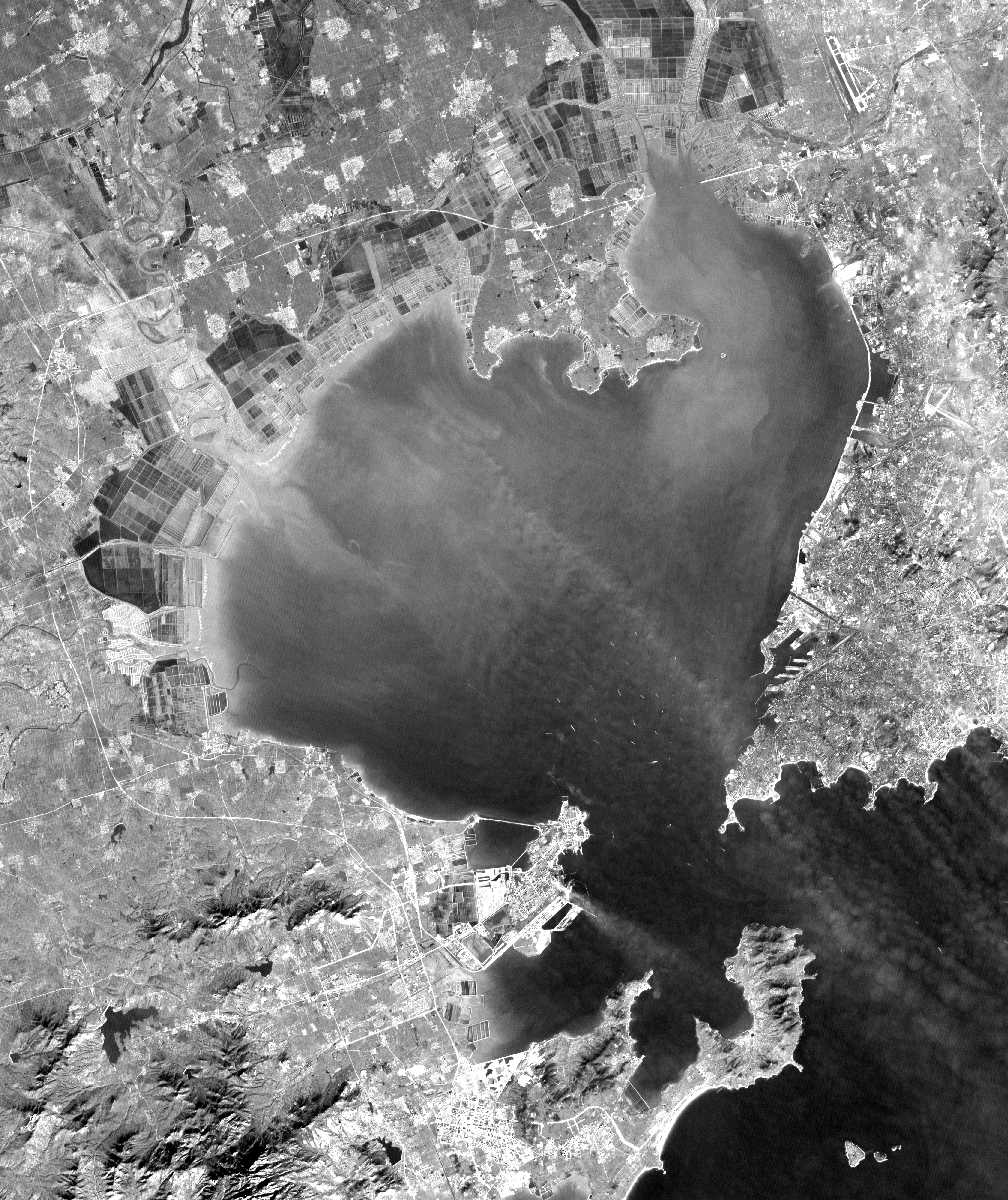
Jiaozhou Bay, located on the western coast of the Yellow Sea (YS), P. R. China (N35 degree 38 minutes-36 degree 18 minutes, E120 degree 04 minutes-120 degree 23 minutes), is a shallow semi-closed bay with a total area of about 400 square kilometers and an average water depth of 7 m. The biological field in Jiaozhou Bay has changed dramatically in the last three decades due to the proliferation of industries, aquaculture, agriculture, and domestic sewage around or inside the bay. Annually averaged concentrations of total inorganic nitrogen and phosphate have increased by a factor of 10 or large from 1962 to 1992. The atomic ratio of total inorganic nitrogen to phosphate was about 10 in 1962-63, but is now up to 24.2. Nitrogen used to be a requisite component for the growth of phytoplankton in Jiaozhou Bay, but now the bay has turned into a phosphorous-limited ecosystem.
|
|
Objective of this US-China cooperative program is to develop an ecosytem model with simulation capability for the lower and high trophic level food web interactions in Jiaozhou Bay, and use it to examine the effects of physical environments on the recruitment of aquaculture productions such as shrimps, scallops and seaweeds. This program was developed at the Third US-China Joint Coordination Panel Meeting on Living Marine Resource, which held during March 11-14, 1997 at Silver-Spring, Maryland. This project is supported by the Georgia College Sea Grant. The US team is The University of Georgia (at now University of Massachusetts) and the Chinese team is The First Institute of Oceanography, State Ocean Administration, P. R. China. The US. principal investigators are Dr. Changsheng Chen (UMASS) and Dr. Mac Rawson (UGA), and the Chinese partner is Prof. Mingyuan Zhu at FIO.
A phosporus-limited biological model of Jiaozhou Bay was developed and coupled into a 3-D physical model (ECOM-si). The model results showed that physical processes in Jiaozhou Bay directly supplied and maintained nutrients but had only an indirect impact on phytoplankton. The temporal variation of phytoplankton was controlled dominantly by biological processes associated with nutrient uptake, grazing by zooplankton, and consumption by shellfish. Shellfish aquaculture can modify the bay-scale balance of the ecosystem in Jiaozhou Bay. The loss of phytoplankton in shellfish aquaculture sites tended to be compensated by advection and diffusion from the surrounding waters. A large consumption of phytoplankton by shellfish can cause a net flux of phytoplankton from the Yellow Sea to Jiaozhou Bay, although there was a net nutrient flux flowing out of the bay. A phytoplankton bloom can occur around the northwestern coast due to the "accumulation" of nutrients under southeasterly wind, which revealed the physical mechanism for the formation of "red tide" that were frequently observed in that region during summer.
This work was completed 10 years ago, and the model results were published in a paper by Chen et al. (1997). |
Selected Images and Animations
|
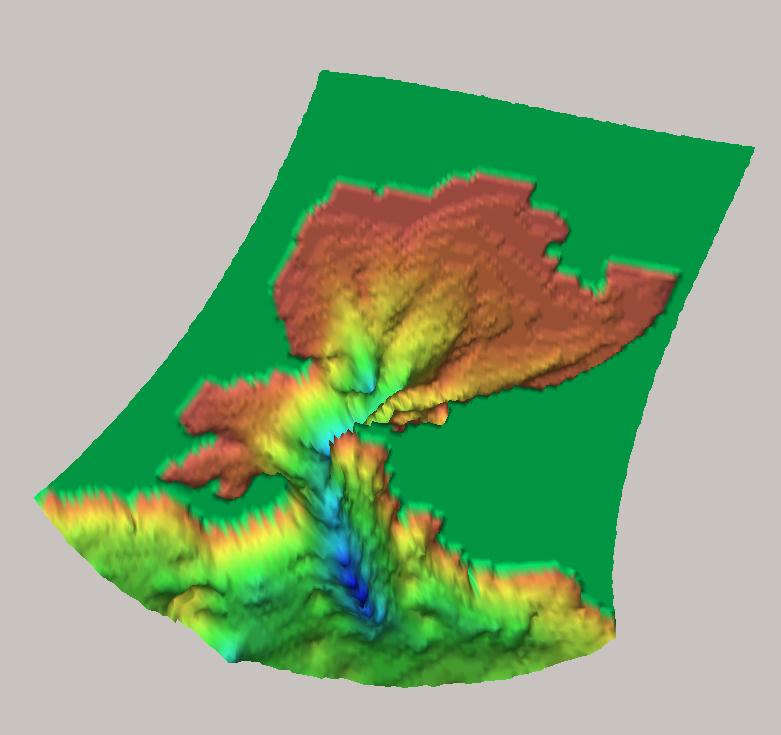
3-D Baythymetry Image
A view of the 3-D bathymetry of Jiaozhou Bay from the Yellow Sea. The Jiaozhou Bay is a typical coatal lagoon where the water exchange with the basin sea mainly through a narrow strait. The maximum depth of the strait is deeper than 30 m, while the averaged depth of the bay is ~ 7 m. Therefore, the tidal current is strongest in the strait.
Click here or image to view a bigger size of figure.
|
 |
Tidal Animation
The M2 tidal current animation over tidal cycles. Color presents the surface elevation and vectors are the near-surface tidal currents. This high-resolution ECOM-si shows that the tidal currents were asymmetric during flood and ebb periods in the narrow Strait. This asymmetry produces double eddy cells at the entrance to the Jiaozhou Bay. Chen et al. (1997) pointed out that periodic tidal forcing over double residual eddies leads to a chaotic water exchange process beteween Jiaozhou Bay and the Yellow Sea.
Click here or image to view a larger size of animation.
|
|
Animation of Water Temperature, Salinity, Phytoplankton Biomass and Phosphate Concentration
The animation of model-predicted near-surface water temperature, salinity, phytoplankton biomass (chl-a concentration) and phosphate concentration. The biological model used in this study is a simple NPZ model with nutrient loading from rivers. The physical model is the structured grid finite-difference model (ECOM-si). This was the best ocean model at that time. The model shows that the phosphate in this bay is controlled mainly by the land loading, and its distribution was influenced significantly by the physical process.
Click here or image to watch the animation. |
|
Animation of Water Temperature, Salinity, Phytoplankton Biomass and Phosphate Concentration on a transect cut from Yellow Sea to the northern end of Jiaozhou Bay
The animation of model-predicted near-surface water temperature, salinity, phytoplankton biomass (chl-a concentration) and phosphate concentration on a transect cut from the Yellow Sea (deper part-right) to the nothern end of Jiaozhou Bay (shallow part-left). The model set up was the same as that shown inthe above animation. Color bar in each panel presents the range of the value for listed variable.
Click here or image to watch the animation. |
|
Animation of Particle Movement: Case 1 with Only Tidal Forcing
a) Particles were released near the surface (red balls) and bottom (blue balls) in a region close to the narrow strait.
The animation shows that when particles reach the double eddy area, their trajectories becomes chaotic. That happened for both near-surface and bottom particles.
Click here or image to watch the animation.
|
 |
Animation of Particle Movement: Case 1 with Only Tidal Forcing
b) Particles were released near the surface (red balls) and bottom (blue balls) near the northwestrn coast of Jiaozhou Bay.
The animation shows that particles moves periodically with tidal cycles and have a southward residual drifting along the coast. After 8-9 tidal cycles, they can reach the strait.
Click here or image to watch the animation.
|
|
Animation of Particle Movement: Case 1 with Only Tidal Forcing
c) Particles were released near the surface (red balls) and bottom (blue balls) near the northeastern coast of Jiaozhou Bay.
The animation shows that particles moves periodically with tidal cycles in that area, with a very weak residual drifting. That is a region with a long residence time, which is favor to have harmful algae bloom as nutrient loading is too high.
Click here or image to watch the animation.
|
|
Animation of Particle Movement: Case 2 with Tidal and Wind Forcing
a) Particles were released near the surface (red balls) and bottom (blue balls) near the northwestrn coast of Jiaozhou Bay. The particles were released at the same locations as in a) of Case 1 except adding winds.
The animation shows that winds accelerate the water exchange process between the Yellow Sea and Jiaozhou Bay. As the same as Case 1, when particles reach the double eddy area, their trajectories becomes chaotic. That happened for both near-surface and bottom particles.
Click here or image to watch the animation.
|
|
Animation of Particle Movement: Case 2 with Tidal and Wind Forcing
b) Particles were released near the surface (red balls) and bottom (blue balls) near the northwestrn coast of Jiaozhou Bay. Particles were released at the same locations as in b) of Case 1 except adding winds.
The animation shows that the southerly wind (blowing northward) can cause the particles move towards the coast. That means that during the summer season, the southerly wind increases the residence time of nutrients in the northwestern coastal region, and thus easy to cause the red tide.
Click here or image to watch the animation. |
|
Animation of Particle Movement: Case 2 with Only Tidal Forcing
c) Particles were released near the surface (red balls) and bottom (blue balls) near the northeastern coast of Jiaozhou Bay. Particles were released at the same locations as in c) of Case 1 except adding winds
The animation shows that the southerly wind (blowing northward) can cause the particles move towards the coast. That means that during the summer season, the southerly wind increases the residence time of nutrients in the northeastern coastal region, and thus easy to cause the red tide.
Click here or image to watch the animation.
|
|
|


