 |
The Study Site
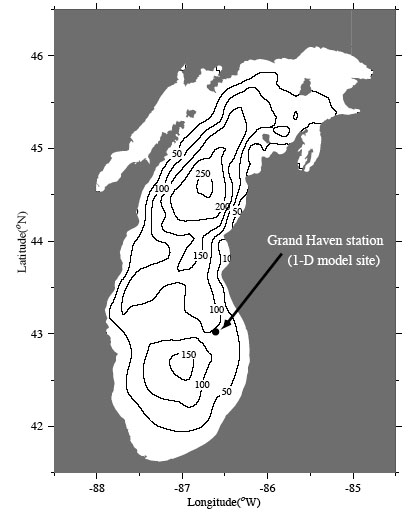
We selected our numerical experiments at a 1-D site located at the Grand Haven station (see image on the right). This site is a GLERL/NOAA and EPA ecosystem monitoring station with a long-term record of both hydrological and biological data. The water depth at this station is about 100 m, and the location is considered to be a transitional site for sediment accumulation (Cahill, 1981). Little sediment resuspension occurred at this station, even during strong plume events. For this reason, we did not include the sediment term in the numerical experiments. The 3-D physical model experiments have shown that the horizontal advections and upwelling are generally one order of magnitude smaller offshore than near the coastal region. Experments were made for 1994-95. |

Click here or image to view the full-size figure. |
Seasonl Struture of Water Temperature
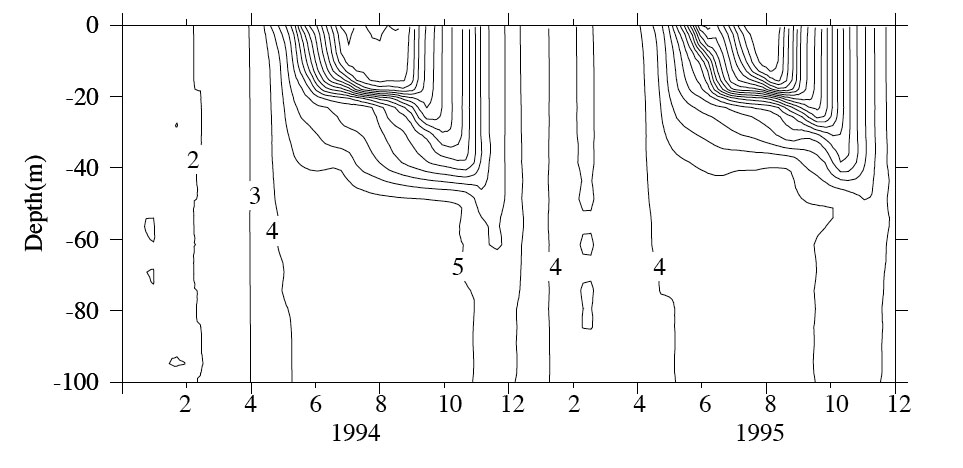
In 1994, stratification developed in early June as a result of surface heating. A continuous warming tendency caused the water in the upper 40 m to be well stratified in late June. The wind-induced mixed layer, defined as a layer in which vertical temperature difference is less than 2.5 degree C, formed in early July and then gradually deepened with time through summer. Cold-front events with strong wind mixing and cooling occurred episodically in autumn, which caused a rapid increase of the thickness of the mixed layer. Correspondingly, a well-defined thermocline formed at depths of 15 to 20 m in early June and then deepened gradually to about 25 m in late August. The intensity of the thermocline decreased considerably in mid-August though early September and then disappeared in late October. A similar seasonal pattern also was found in 1995, except that the onset of thermal stratification occurred about 10 days earlier.
|

Click here or image to view the full-size figure. |
Model-Data Temperature Comparison
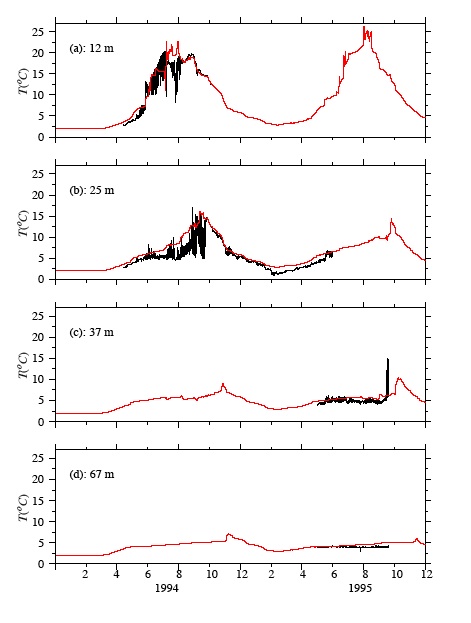
The model-predicted temperature is in good agreement with the observations taken at depths of 12, 25, 37, and 67 m (Fig. 4). Based on these agreements, the model results suggest that 1995 had a warmer winter and summer compared with 1994. The difference in temperature between these two years was about 2o C in winter and 5o C in summer. It is not surprising that the model-predicted temperature curve is much smoother than the observed temperature curve, since the model is only 1-D and the model predicted field is smoothed each time step to ensure the numerical stability.
|
|
Seaonal Variations of Nutrients and Phytoplankton
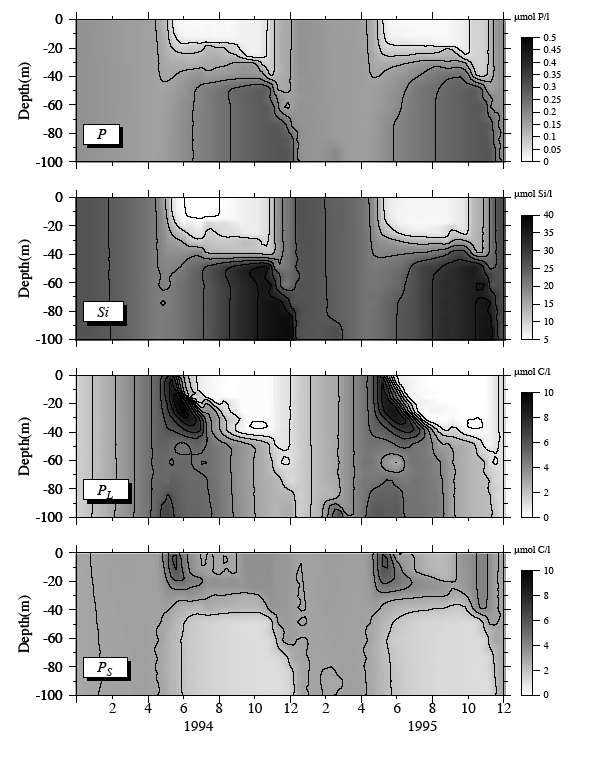
The easonal variation of biological variables is closely associated with the seasonal distribution of temperature. Both phosphate and silica concentrations in the upper 20 m decreased rapidly as stratification developed, and then remained minimum within the mixed layer during summer through autumn as the thermocline formed. Relatively large values of phosphate and silica were found below the thermocline in late summer, and then concentrations vertically well mixed again in winter. Large phytoplankton grew rapidly in the upper 40 m as stratification developed. A maximum value occurred near the surface in late May and then shifted to a depth of 30 m below the surface in late June. When the thermocline formed, in the upper 40 m collapsed rapidly in a short period. Subsequently, small phytoplankton grew near the surface in late May, with remarkable variation in the mixed layer during summer.
|
|
Seaonal Variations of Nutrients and Phytoplankton
Seasonal distributions of large and small zooplankton were cohered well with seasonal patterns of detritus and bacteria. The bcteria abundance grew significantly in the subsurface as stratification developed and remained lower within the mixed layer in summer through autumn. The abundance became vertically uniform in winter as a result of wind mixing and surface cooling. Similar seasonal patterns were also found for zooplankton, even though the maximum biomass of these two variables were about four times smaller. Detritus was vertically well mixed in the winter. It significantly increased as stratification developed. Similar to other biological variables, detritus remained at a minimum in the mixed layer in summer through autumn. Two extreme values were found over seasons: one was at the depth of 35 m in late June and the other near the bottom in late August. Tracing back to two separate components of detritus, we found that the subsurface maximum was dominated by the phosphorus-related component and the bottom extreme detritus mainly came from the silicon-related component.
|
|
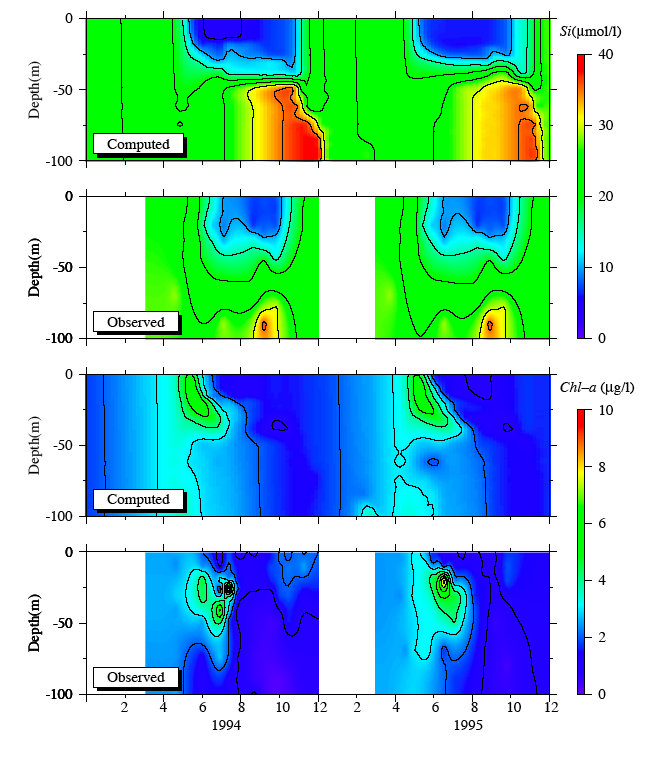
Model-Predicted and Observed Silcon and Chl-a Comparison
The model-predicted vertical and seasonal distributions of nutrients and phytoplankton agree with the field measurement taken at the Grand Haven station. The model predicts a sharp vertical gradient of silicon in the thermocline area, which was unresolved in the observational data because of a coarse sampling resolution in the vertical. The observations also show that chlorophyll-a was uniform vertically in winter, grew significantly and reached a maximum at the subsurface in early June, and was then depleted in summer. These vertical and seasonal features also are evident in the model-predicted total phytoplankton biomass. |
|
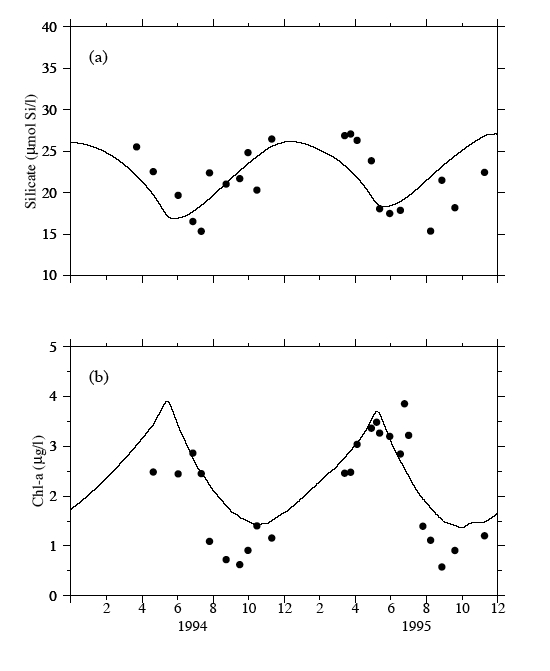
Model-Predicted and Observed Depth-Averaged Silicon and Chl-a Concentrations
Model-predicted, depth-averaged silicon and chl-a concentrations coincide well with the seasonal distribution of silicon and chlorophyll-a. The model results show that depth-averaged concentration of silicon reached a minimum level of 16.5 umol Si/l in late June and a maximum level of 25 umol Si/l in January, which matched the seasonal distribution of observed silicon over two years. The model-predicted chlorophyll reached a maximum level of 3.9 ug/l in mid-June and a minimum level of 1.4 ug/l in early November in 1994 and then again a maximum level of 3.7 ug/l in mid-June in the subsequent 1995. This model-predicted seasonal distribution of phytoplankton matches the observed chlorophyll-a concentrations, especially in 1995.
|
|
|
