 |
 |
QuikScat Wind Simulation |
QuikScat wind data sites
The satellite scatterometer QuikSCAT has been recorded wind data on the water surface of Lake Superior since 19 July 1999. The near-surface neutral winds are estimated through the microwave back-scatter from the wind-disturbed water surface. The wind vectors are provided with a spatial resolution of about 25 km and time interval of 12 hours over the interior of Lake Superior. Due to spurious reflection from ices, land and rain, the reliable QuikSCAT wind data are only available in the interior region of about 35 km away from the coast in spring through fall.
Click here or image on thr right to view the full-size figure.
|
|
Surface Temperature comparison
Given the same surface heat flux, the simulation of the low-frequency (40-h low-passed) trend of model-computed surface water temperature was improved markedly at buoys 45004, 45006 and 45136 after wind forcing was replaced by the QuikSCAT data. The model simulated surface water temperature was compared with the satellite-derived surface temperature. The model did capture the basic seasonal pattern of the temperature variation, but seemed to fail to reproduce the meso-scale variation along the coast, especially for the upwelling and downwelling.
Click here or image on the right to view the full-size figure.
|
|
Surface temperature image comparison
A cold water band, an indicator of the upwelling, was clearly identified along the Keweenaw Peninsula in the satellite-derived surface temperatures received at 4: 54 EST on 14 August. Although this cold water band was resolved in both cases with buoy and QuikSCAT winds. It seemed that its spatial coverage was underestimated in the buoy wind case. The cold water band detected on the satellite image appeared in a long and narrow area from the northeastern end of the Keweenaw Peninsula to the southwestern end of the lake. This spatial pattern was reproduced in the QuikSCAT wind case, but it was limited only to the northeastern coastal area of the northern entrance of the waterway of the Keweenaw Peninsula in the buoy wind case.
Click here or image on the right to view the full-size figure. |
|
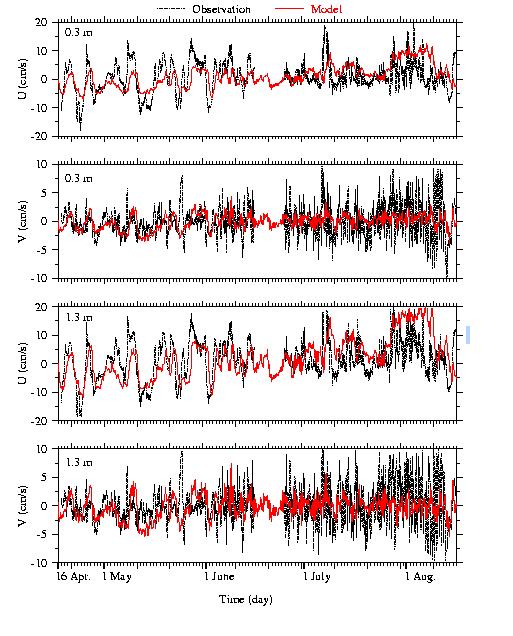
Current comparison
The improvement in the simulation of the low-frequency along-shore current by the QuikSCAT wind was clearly evident during the downwelling-favorable wind events in mid-September. The ADCP data showed two strong along-shore currents at site 3 in September, with a speed of 60 cm/s at a depth of 17 m. These along-shore currents were captured up to 50~67% by the QuikSCAT wind, while only to 40%~50% by the buoy wind
Click here or image on the right to view the full-size figure.
|
|
Temporal and vertical distributions of the velocities observed by ADCP and predicted by the QuikSCAT winds were in reasonable agreement, but were underestimated significantly by the buoy winds. Even in the cross-shore direction, the velocities predicted by the QuikSCAT wind provided a better agreement with observed velocities than that predicted by the buoy wind.
Click here or image on the right to view the full-size figure. |
|
Time series comparison
No matter what kinds of the wind fields were used, the ECOM-si underestimated the magnitude of the Keweenaw Current during the comparison period, though it did captured all the wind-induced variation trends of the curren.
Click here or image on the right to view the full-size figure. |
|
|


