|
TEXAS AND LOUISIANA SHELF
|
| |
| Observed Near-Inertial Oscillations |
Wind-induced, near-inertial oscillations over the Texas-Louisnan Shelf in spring and summer 1992 are described using the current and wind observations takesn during the first year of the Texas-Louisiana Shelf Circulation and Transport Processes Study (LATEX A). Rotary spectral analysis shows clockwise-rotating energy peaks at near-inertial frequencies for records from all current meter moorings after the suppression of principal tidal signals. The vertical structure of near-inertial oscillations is characterized by a first baroclinic mode with a near 180 degree phase difference between the upper mixed layer and lower stratified layer. The oscillations are intermittent with a modulation timescale of about 5-10 days. They are surface-intensified and have maximum values near the shelf break, decaying gradually toward the coast but rapidlly offshore. Near-inertial oscillations appear to accompany a sudden change of the wind stress during frontal passages. Diagnostic analysis suggests that the large near-inertial ooscillations over the LATEX shelf are mainly generated by high-frequency (near-inertial) variation of the wind stress accompanying the passage of atmospheric fronts. When the downward transfer of the near-inertial energy to the deep stratified layer is small, a simple mixed layer model forced by the observed wind stress provides a reasonable prediction of the near-inertial currents in the mixed layer.
The observational and synthesis results were published in an article by Chen et al. (1996).
|
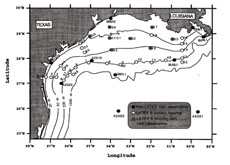
Locations of current meter moorings and meteorological buoys from which data are used in the near-inertial oscillation study. The LATEX A meteorological buoys are located at mooring 17, 19, 20, 21/51, 22, 50, 51, and 54. Non-LATEX meteorological observations are indicated by solid circles.
Five types of current meters (Endeco 174 SSM and DMT, Aanderaa RCM 4/5 and 7/8, and InterOcean S4) were deployed in the LATEX A array poctured in the figure on the right. Instruments were placed at three nominated depths of 10-12, 100 and 190 m on mooring located on the outer shelf and at depths of 10-12 m and near bottom on mooring located in less than 100-m water depth.
|
Click here or image to view the full-size figure. |
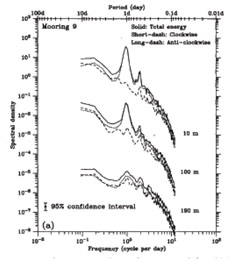
Rotary spectral of current records from (a) depths of 10, 100 and 190 m at mooring 9 and (b) 10 to 12 m instruments on moorings 15, 21 and 2. The spectra at 100 m in (a) and mooring 21 in (b) are shifted downard by 100 and spectra at 190 m in (a) and mooring 2 in (b) are shifted by 10000. Estimates of rotary spectra were made using the 3-hour, low-passed data sampled hourly from April 15 to July 22, 1992. Segment points of 256 with overlap points of 128 were used for spectral analysis. Spectral density is in (cm/s)^2/cpd.
A prominent spectral peak centered at near-diurnal frequency was found at all levels, and the amplitude decreased with increasing depth. The energy distributiong to this near-diurnal peak was essentially all clockwise-rotating motion near the surface and middepth, with somewhat larger contributions from counterclockwise rotation near the bottom.
|
Click here or image to view the full-size figure |
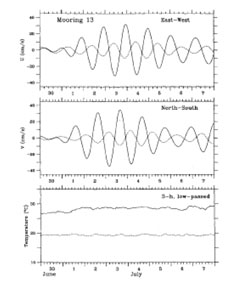
In general, the amplitude of near-inertical currents decreased with depth at each mooring over the entire shelf. Example is shown in the figure on the right. The maximum amplitude of oscillating currents during a strong near-inertial event in early July was near 30 cm/s at 12 m but decreased with depth to about 10 cm/s at 100 m.
Vertical phase distribution of near-inertial currents was characterized by a first-baroclinic model-like strcuture in mixed and stratified layers. In an example shown on the right, near-inertial oscillations at 100 m were about 180 degree out of phase with those at 10 m at the time of the strong oscillation event in the early July. The mixed layer depth was about 12 m during that event, and the temperature contrast between the two instruments was large. The resulting vertical structure of oscillations was similar to that in a two-layer system. Such vertical structure in velocity tends to disappear when the vertical density stratification becomes weak. |
Click here or image to view the full-size figure. |
Distributon of the variance of the band-passed, residual currents observed from April 15 to July 22 1992 at three cross-shelf setions over the LATEX shelf. Mooring numbers are shown above each section. The contour units are cm^2/s^2.
The cross-shelf differences of neaar-inertial energy are cllearly seen in the cross-shelf distributions of the variance in the right figure. The variance of near-inertial motions is maximum near the shelf break at all measured locations on the LATEX shelf and decays gradually onshore but rapidlly offshore. The maximum value of variance were about 100 cm^2/s^2 (at 10 m) at the shelf break, while the near-surface (10 m) values over the inner shelf were about 20 cm^2/s^2.
Along-shelf distribution of near-inertial energy at the 200-m isobath was complex. The variance estimated by the band-passed current records from mid-April to late July shows rether low, near-surface energy llevels at moorings 48, 8, 6, and 47, and highs at mooring 10 and 5. Few differences were observed in the along-shelf direction for the energy level of deeper near-inertial oscillations.
|

Click here or image to view the full-size figure. |
| Mechanism Study of Near-Inertial Oscillations |
The wind-induced, near-inertial oscillations over the Texas-Louisiana shelf were studied using a tow-dimensional primitive equation model forced by an impolse of the surface wind. Numerical experiments reproduced the cross-shelf structure of observed near-inertial oscillations. For a given spatially uniform impulse of the wind, the model predicted the large near-inertial oscillations that were surface-intensified and characterized by a first baroclinic mode in the vertical. The oscillations reached a maximum kinetic energy near the shelf break and decayed gradually towward the coast but rapidly offshore. The magnotide and cross-shelf distribution of the wind-induced, near-inertial energy changed with wind direction. Effects of nonlinear advection on near-inertial oscillations were largest near the shelf break and decreased both onshore and offshore where the bottom topography was gentle or flat. They were stronger during the wind event and weaker after the wind ceased. Nonlinear interactionof tides and wind was weak on the shelf. However, it tended to provide a positive net contribution to near-inertial currents for both cases where tides were in and out of phase with winds. A simple theory suggests that the cross-shelf variation of near-inertial oscillations was controlled by the cross-shelf gradient of surface elevtiomn and the vertical gradient of Reynolds stress. The results were published by Chen et al. (1997) on JGR.
|
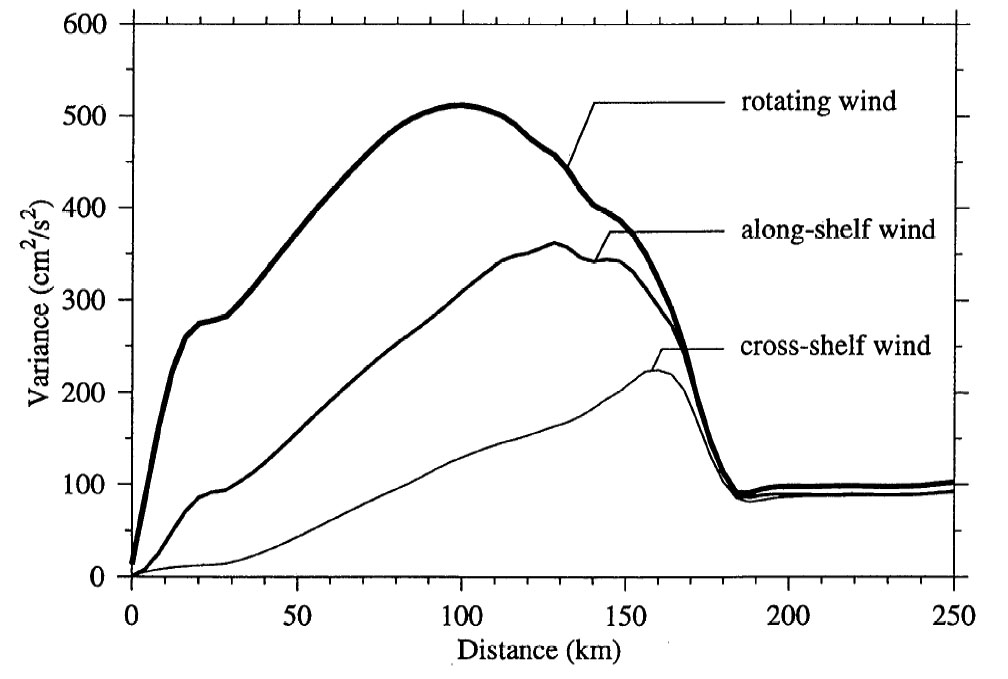
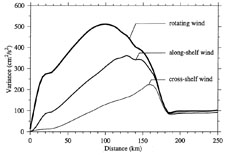
Distribution of the surface variation of the band-passed, near-inertial currents for the stratification cases with the cross-shelf, along-shelf and clockwise rotating winds.
For a given maximum wind speed of 10 m/s, the maximum variance of inertial currents was 363 cm^2/s^2 in the case forced by the along-shelf wind, which was 129 cm^2/s^2 larger than that in the case forced by the cross-shelf wind. The maximum variance increased to 512 cm^2/s^2 in the case forced by the rotating wind.
|
Click here or image to view the full-size figure. |
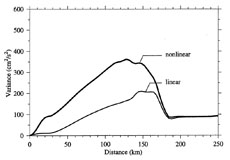
Distribution of the variance of the linear and nonlinear band-passed, near-inertial currents at the surface for the stratification case forced by the long-shelf wind.
The basic cross-shelf structures of the variance of near-inertial currents were very similar in both nonlinear and lineaar cases, but the amplitudes was much larger in the nonlinear case than in the linear case. The nonlinear effects were more important over the shelf and can be ignored off the shelf break.
|
Click here or image to view the full-size figure. |
| Coupled Biological and Physical Modeling Experiments |
|
A simple coupled biological and physical model was used to examine the impacts of river discharge on biological variability on the Louisiana-Texas (LATEX) continental shelf. The physical part included a primitive-equation turbulent closure model, and the biological part was a simple phytoplankton (P), zooplankton (Z), and nutrient (N) model. The model was forced by freshwater discharge from a river and ran prognostically under initial conditions of springtime water stratification and a steady-state P-Z-N solution with a nutrient flux from the river. The model predicted a well-defined density frontal zone on the inner shelf. The biological field showed a region of high phytoplankton biomass in the whole water column near the coast and a moderately high biomass patch in the upper 10 m at the outer edge of the frontal zone. New production of nutrients was high throughout the whole water column near the coast and in the upper 10 m at the outer edge of the density front, but lower in the frontal zone. The model experiments suggested that the bottom-rich nutrient distribution found within the frontal zone was caused by the interaction of physical and biological processes. Physical processes caused the formation of an area of high nutrient concentration in the weak current region within the frontal zone. Subsequent biological processes limited the increase of nutrients in the upper euphotic zone and hence led to the bottom-rich nutrient pattern.
The objective of this research is to explore the influences of river discharges on biological production over the Texas and Louisiana shelf. The results was published on Journal of Marine Research: Vol 55, 293-320, 1997. See Chen et al. (1997).
|
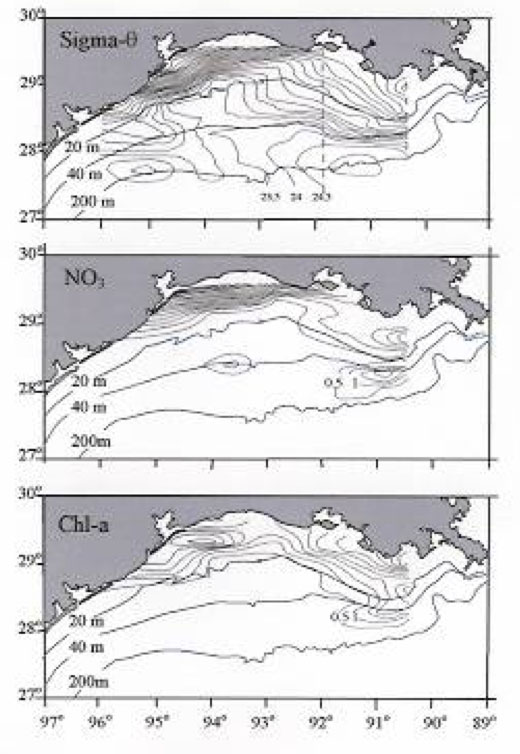
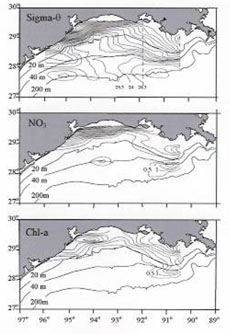
Distributions of the surface density, nitrate and chlorophyll-a during April 26- May 10, 1993. Solid circles represent the measurement stations. Filled downtriangles indicate the locations of the rivers.
The filed memasurements showed a high level of nutrients and phytoplankton biomass in the inner shelf, which was strongly linked to the unusally large freshwater discharge from the Mississippi and Atchafalaya River (MAR) system. The average freshwater flux during May 1993 was about 32,900 m^3/s at the Mississippi RIver and 14,700 m^3/s at the Atchafalaya River, which was about 10,000 m^3/ (Mississippi River) and 6,00 m^3/s (Atchafalaya River) l larger than the May discharges averaged over the sixty-two year records from 1930 to 1992.
High nitrate concentrations, which were observed near the bottom on the middle shelf, resulted from the interaction of biological and physical processes associated with a low salinity front.
|
Click here or image to view the full-size figure |
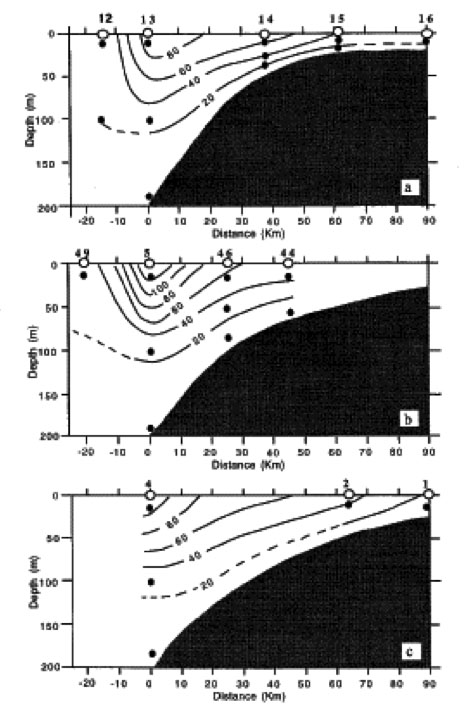
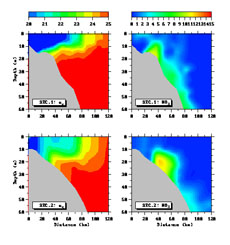
Cross-shelf distributions of the density and nitrate on section 1 and section 2 shown in the above figure.
Hydrographic data, taken from the May 1993 interdisciplinary survey, showed a relativeley strong, low-salinity (or density) surface-bottom frontal sonze near the 20 to 40-m isobath. In addition to a high concentrtion of nitrate and chl-a near the coast, nitrate concentrations showed a distinct maximum value at the bottom, within the low-salinity front that was located at the 20- to 30-m isobaths on section 1 and at 20- to 40-m isobath on section 2. This bottom-rich nitrate pattern extended offshore to a region of deeper than 60 m on section 1, the section between the Mississippi and Atchafalaya Rivers. However, on section 2 west of the Atchafalay River, the nitrate maximum dome seemed to be isolated from the outer intriate source.
|
Click here or image to view the full-size figure |
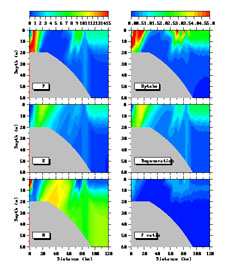
Model-predicted distributions of the biological field at the end of the 30th model day. In the left panel, top: phytoplankton (P), middle: zooplankton (Z), bottom: nutrients (N). In the right panel, top: nutrient uptake by phytoplankton; middle: nutrient regeneration; bottom: the f-ratio.
Nutrients were lower throughout the whole water column in the inner-shelf region about 7- to 20-km offshore. The maximum nutrient levels were found in the upper 10 m over a region of 7 km front the coast. A dome of high-nutrient water developed near the bottom within the frontal zone between 20- and 40-m isobaths. This model-predicted dome structure was very similar to that observed from the May 1993 LATEX survey. Correspondingly, the maximum phytoplankton biomass concentration developed throughout the whole water column close to the mouth of the river. At the outer edge of the density front, a high biomass phytoplankton patch streched downward from the surface to the depth of about 20 m. Phytoplankton biomass was lower within the frontal zone between 20- to 60-m isobath.
|
Click here or image to view the full-size figure |
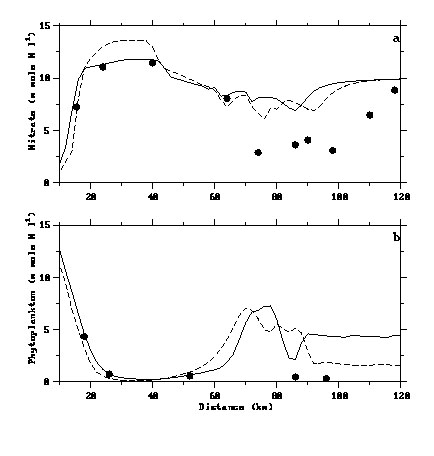
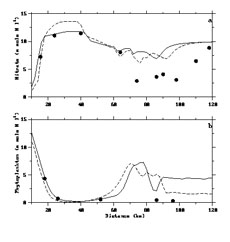
Comparison between model results and observations for (a) the nitrate at the bottom; and (b) the averaged phytoplankton in the upper 10 m. The model-predicted data are represented by solid (nonsinking) and dashed (sinking) lines. The observed data are indicated by filled circles and were taken from bottle samples on Sec. 2, the May 1993 interdisciplinary LATEX survey.
The distribution of observed nitrate near the bottom agreed both qualitatively and quantitatively with model results in the inner shelf within the frontal zone. The distribution of observed chlorophyll a near the surface also agreed well withmodel results in the inner shelf within the frontal zone. Poor agreement between observed data and the model’s predictions in phytoplanktoncan be accounted for by insufficient sampling and the fact that the sinking behavior of
phytoplankton was not taken into account.
|
Click here or image to view the full-size figure |
|