Model Validation, Code Parallelization, FVCOM Forum, FVCOM Registration, FVCOM User Login

Field Measurement Accomplishment

Field measurements were made for two purposes: 1) mixing and water transport studies (led by Dr. MacDonald) and 2) model validation (led by Dr. Zhao with support from Drs. Chen and Cowles). The key finding of these field works is described as below.

a) September 2004 and April 2005 Surveys

These two surveys were made by Dr. MacDonald and his students to examine the role of mixing in the structure and evolution of a buoyant discharge plume. Major finding from these two field works are described in two separate manuscripts prepared by MacDonald and his student. The measurement made in fall 2004 was under a condition in which buoyancy of the plume was controlled by temperature and the plume was trapped at the surface. Field measurements indicate strong mixing across the first several hundred meters of the near field of the plume, and suggest that the mixing occurs as a result of bottom friction focused along the edges of the plume structure. The plume structure observed is different from conceptual models of industrial plumes based on previous laboratory and numerical studies. The results indicate that the existing discharge structure provides a quick and efficient means of mixing heat into ambient waters.

An estimation was made on the residence time of a semi-enclosed estuary with observations of tidal exchange flow. The result illuminates the issue of bulk residence time for Mt. Hope Bay. Although the concept of residence time is simple, an effective estimate of residence time can be difficult to achieve in practice. Analysis of tidal flux through the seaward passages of Mt. Hope Bay provided an estimated residence time, based strictly on tidal exchange processes, on the order of 2 weeks to a month. A comparison of these values with appropriate freshwater flushing times suggests that tidal exchange processes may only be important during low freshwater flow periods.

b) August 2005 Survey

The field plan was designed by Dr. L. Zhao with support from Dr. Chen and Dr. Cowles. This was a multi-institutional cooperative high-resolution sampling survey with participation of scientists from Woods Hole Oceanographic Institution (WHOI) and NOAA Northeast Marine Fisheries Service at Woods Hole. The measurement included 1) ship-mounted ADCP and CTD and 2) satellite-tracking surface drifters. Dr. MacDonald and his student helped setting up the CTD/ADCP for this cruse and WHOI and NMFS provided two surface drifters and Mr. Jim Chruchill at WHOI participated in the first day survey.

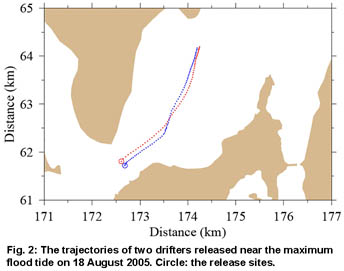
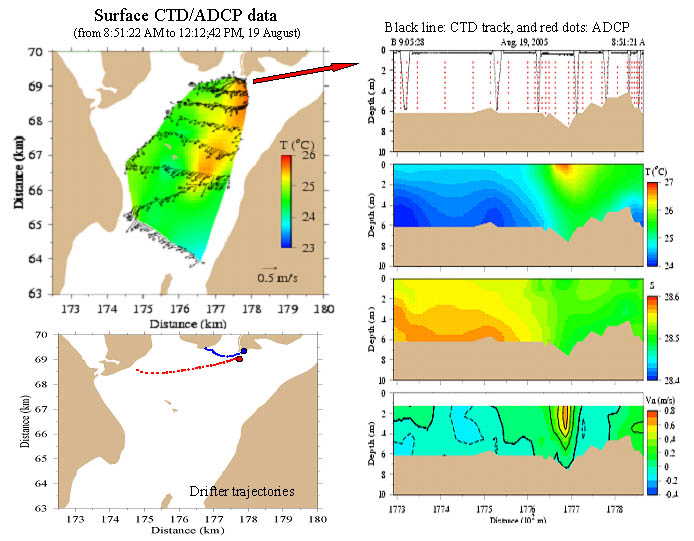
The survey was made on 18-19 August 2005, a period with the maximum spring tide in the year. On 18 August, the CTD/ADCP measurement was conducted repeatedly on the ship-track shown in Fig. 19. Two drifters released at maximum flood tidal current in afternoon near the MHB Bridge to measure the intensity of tidal flushing and current separation. The CTD/ADCP data are still undergoing postprocessing, and drifter trajectories clearly showed the rapid motions caused by tidal flushing. Two drifters ended in the upper part of the MHB, which is consistent with the FVCOM-prediction. Due to the relatively strong seabreeze from the land, the drifters all

quickly converged into strong tidal flushing current zone, so no current separation was resolved in these drifter measurement (Fig. 2). A numerical experiment was made after the drifter measurement and results show that the current in the shallow area of MHB varies significantly due to the daily seabreeze. The tidal flushing-generated eddy field can disappear when the seabreeze was strong. Also, the current separation happens at edge of the current jet where the lateral shear of the current is strongest, two drifters were not sufficient to resolve the strong shear structure predicted in the model and previous ADCP measurements.

On 19 August, the tow-yo CTD/ADCP measurement was made repeatedly along ship tracks shown in Fig. 3. Two satellite-tracking drifters were released at the maximum ebb tidal current in the center of the hot-water plume detected by the tow-yo CTD and ADCP measurement.

The CTD/ADCP data are still under calibration and processing status. Preliminary results clearly show that the buoyancy plume was characterized by a narrow jet with a width of about 30-40 m. During the ebb tidal current measured on 19 August 2005, the plume was surface-trapped, with a maximum temperature core in the upper 2 m. This plume was advected into the MHB as a jet current for a distance of about 6-10 km. The trajectories of two surface drifters turned clockwise and moved to the western coast, which provided an evidence of the return flow on sides of the plume due to shear instability-induced current separation. In addition, drifter trajectories really suggest that there were a large spatial variation in the current in the plume area. The trajectory could be significantly different when drifters were released at different times and locations. This again supports the need of an advanced high resolution model for MHB study.

Fig. 4: Examples of the tow-yo CTD/ADCP/drifter measurement results taken on 19 August 2005. Upper left: the distribution of the surface temperature and current vectors; lower left: the trajectories of two surface drifters; and right: the distributions of water temperature, salinity and current normal to the transect across line A-B. The width of the plume detected from this survey was about 30-40 m, and maximum current at the core of the plume was over 60 cm/s. The drifters show the recirculation cell flow on the side of the plume. tio

The field of the ADCP current vectors shown in Fig. 4 indicated a weakly return flow on the left side of the plume jet. Because the current varied dramatically with time and space and it took about 3 hours to complete one track covering all transects, the flow field shown in the figure does not represent a snapshot of the current field at the ebb tide. It raises a critical question on how we could make these data useful to understand the plume dynamics in that region. We are proposing to use two approaches to process these data. First, we are using a least-square fitting method to filter tidal currents and then construct the buoyancy subtidal flow field using the filtered data. This would provide us a direct view of the lateral and vertical variation of the plume jet during tidal cycles. Second, we are running the FVCOM by assimilating observed CTD/ADCP data through Ensemble Kalman Filter. This approach would allow us to re-sampling the current field at fixed times to get a series of snapshots of the current structures together with hydrographic field. A synthesis analysis will be made on the assimilated data to understand the plume variation and its impact on the water temperature increases in MHB. Since ADCP data file are huge in size, it takes the time to calibrate and process these data before they could be added into the model.


Copyright © 2005
SMAST/ UMASSD
All rights reserved

Home           About Us           FVCOM            Research           Publications           Contact Us           FAQ