|
Buoyancy-Driven
Flow due to River Discharges
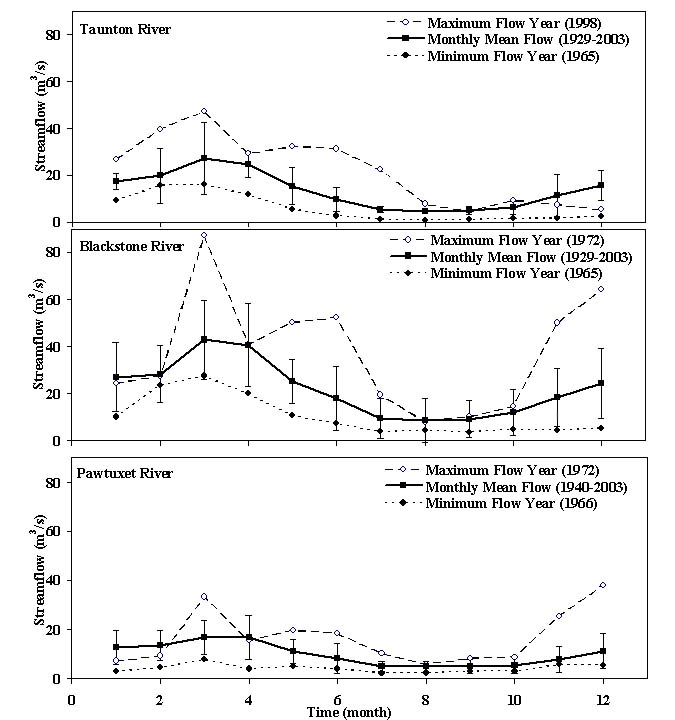
Freshwater discharges into
Mt. Hope Bay (MHB)/Narragansett Bay (NB) are mainly from
three major rivers: the Taunton River (TR) at the northeastern
head of MHB, and the Blackstone and Pawtuxet Rivers (BR
and PR) at the northwestern head of NB (note that the
PR usually refers to the combination of BR and PR). Annual
average discharge rate (based on outflow data from 1929-2003)
is about 14 m3/s for the TR, 22 m3/s for the BR, and 10
m3/s for the PR (Fig. on the right). The peak of individual
river discharge usually occurs in December and March,
with a monthly-averaged discharge rate of about 40 m3/s.
The river discharge rate exhibits a significant interannual
variability. In the extreme large discharge year, for
example in 1972, the maximum discharge rate in the BR
exceeded 60 m3/s in December and 80 m3/s in March. Unlike
other years, the additional discharge peak occurred in
June in 1972, with a maximum rate of > 40 m3/s. In
an extremely low discharge year, for example 1965, the
maximum discharge rate in the BR was only about 20 m3/s
and occurred in March.process-oriented experiment was
made to examine the impact of river discharges on the
s
|  |
|
Although the
total river discharge rate into NB/MHB is much smaller
than the major rivers in the western Gulf of Maine and
southeastern US coast, it is significant due to the limited
size of NB/MHB (~3.7´108 m2), its semi-enclosed
geometry, and shallow mean depth (~ 5.5 m). The
river discharge has a direct impact on the seasonal variation
of the near-surface stratification and nutrient loading
into the bay (Weisberg, 1976; Weisberg and Sturges, 1976;
Kremer and Nixon, 1978). The buoyancy-induced flow in
NB/MHB is driven mainly by freshwater discharges from
rivers. This flow is characterized with a surface-bottom
mixed frontal circulation in the shallow region where
the water is vertically well mixed and a surface-intensified
frontal current in the region where the water is vertically
stratified (like the PR). |
| A process-oriented experiment
was made to examine the impact of river discharges on
the sub-tidal circulation in MHB/NB. We ran the model
using the real time tidal and river discharge conditions
for the selected period of March 15 to April 14, 2001:
a period with large daily river discharges. In the PR
(BR and PR combined), two peaks occurred during that period:
one on March 14 and another on April 1. The maximum discharge
rate was over 350 m3/s. The temporal variation of the
river discharge in the TR is in the same phase as the
PR, except the maximum discharge rate was about 50% less.
To separate the temperature and freshwater driven flows
in this system, we ran the model with a constant salinity
background field in which no water temperature was included.
A value of 35 psu is specified uniformly before the freshwater
is added into the computational domain.
The freshwater input generates a buoyancy-driven
sub-tidal current: flowing southwestward around the river
mouth, westward in the upper MHB region, and then southward
along the western coast. This current split into
two branches around the downstream headland coast. The
first flows southwestward and enters NB on the western
coast. The second moves southeastward, then rotates anti-cyclonically
and eventually flow into NB on the eastern coast. After
30 days, the entire MHB shows the outflow to NB and SR
near the surface. As a result, most of eddies, which
are observed in the residual field in the case with the
only tidal forcing, disappear or considerably weaken (See
the picture below). The outflow (MNB to NB), which is
characterized by low-salinity water, occupies the water
column throughout the western and eastern coastal regions
of the NB/MHB channel. The lowest salinity is in the upper
5 m in the western coastal region, which corresponds to
the location of strongest outflow. In the interior of
the channel, the current is characterized by a two-layer
flow system: a weak outflow near the surface and a relatively
strong, inflow beginning 5m from the surface that intensifies
with depth.

The river discharge induced sub-tidal
buoyancy flow may vary in intensity and direction with
the amount of river discharge rate and background stratification.
During August 18-19 2005 survey, we did observe the low-salinity
profile on both western and eastern coastal side on the
cross-channel section near the MHB Bridge, which is consistent
with the model-predicted pattern described here. |
|
|
|