 |
Tida Simulation
In the last decade the tide-, river discharge-
and wind-induced circulation in Narragansett Bay (NB)/Mt.
Hope Bay (MHB) has been examined using various structured
grid models (Gordon and Spaulding, 1987, Swanson and Jayko,
1987, Spaulding et al., 1999). Gordon and Spaulding (1987)
applied a traditional finite-difference model to simulate
the tidal motion in NB. Forced by M2 and M4 tidal constituents
at the open boundary, their model reproduced the M2 and
M4-induced tidal waves in good agreement with observations
at tidal gauges. A similar effort was also made by Spaulding
et al (1999), who included 37 tidal constituents for the
purpose of improving the accuracy of tidal simulation.
Due to poor resolving irregular coastline of islands,
estuaries, and channels and sharp gradient of the local
bathymetry in the deep channel, previous models failed
to resolve strong tidal flushing and eddy formation through
MNB-NB channel and MNB-SR channel. Failure to resolve
these dynamic structures makes those models unable to
accurately estimate and simulate the water exchange between
MNB and its adjacent regions. This is one of critical
reasons that we have introduced the unstructured grid
FVCOM to MHB/NB. |
|
The tidal simulation
made by FVCOM in NB/MHB was described in detail in Zhao
et al. (2006). A brief summary of our results are presented
here to elucidate the capability of FVCOM in resolving
the complex tidal dynamics in this region.
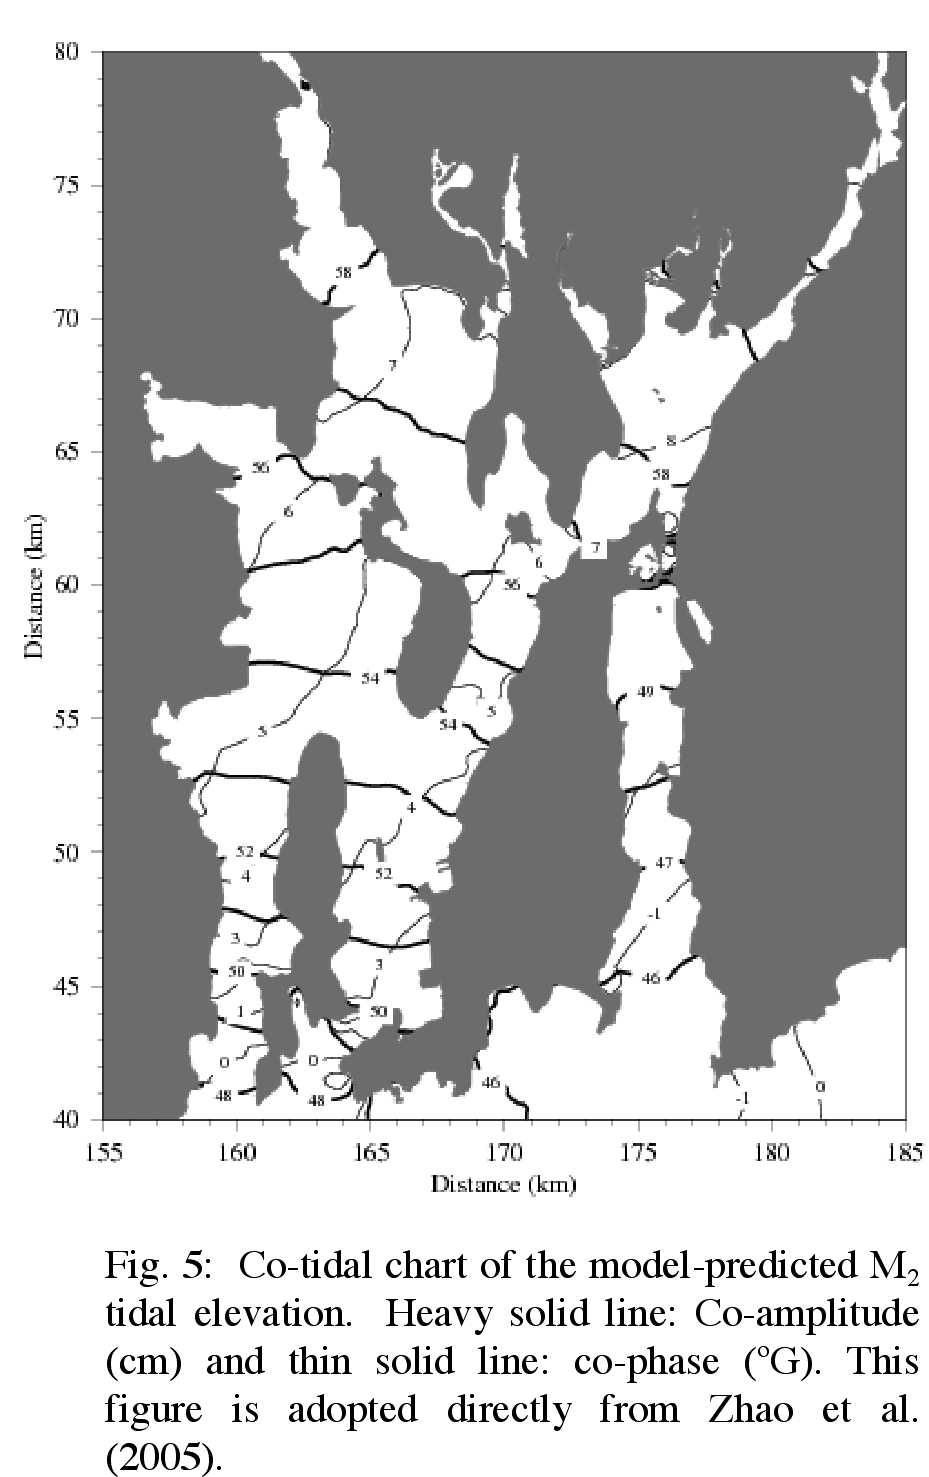
FVCOM successfully reproduces a tidal
induced inertial gravity surface wave propagating into
NB/MHB from the inner shelf dominated by the M2 frequency.
Due to Coriolis effects, at the same latitude, the tidal
amplitude is slightly higher on the right-side coast
than on the left-side coast. Consistently, the wave
phase propagates slightly faster on the right side than
on the left side (see Fig. 1). The tidal amplitude
is about 46-48 cm at the entrance of the bay and increases
gradually to 58-59 cm at the northern end, while the
phase difference from the entrance to the northern end
is 8 degree, about 17 minute lag for the M2 tidal wave
to arrive at the northern end from the entrance. The
tidal phase in MHB is only 1-2o different from that
in the upper NB, indicating that it takes only 2-4 minutes for a
tidal wave from upper NB to reach the upper end of MHB.
Such a small difference in phase implies that NB and
MHB links closely with respect to the tidal process,
so that they act like an integrated dynamic system. |
 |
A direct comparison between computed and observed
amplitudes and phases of five major tidal constituents was made
at five tidal gauges available around the coast of NB/MHB. The
standard deviations between model-predicted and observed amplitudes
and phases are 0.22 cm and 0.16oG for M2 tide, 1 cm and 0.66oG
for S2, 0.06 cm and 0.69oG for N2, 0.11 cm and 0.66oG for K1,
and 0.05 cm and 0.84oG for O1, all of which are within the range
of the measurement uncertainty (Table 1). Computed ratio of
tidal constituents is 0.22 for S2/M2; 0.25 for N2/M2; 0.12 for
K1/M2; 0.09 for O1/M2, indicating that M2 tide accounts for
about 70-90% energy of the tidal motion in the bay.
Unlike previous structured grid finite-difference
models, FVCOM uses an unstructured triangular mesh with a horizontal
resolution of less than 50 m in the deep channel of NB/MHB and
MHB/Sakonnet River (SR). This model captures a remarkable
jump in both the amplitude and phase of the M2 tide on the northern
and southern side of the Sakonnet River Narrows (SRN), which
were not resolved in previous modeling efforts in this region
(Zhao et al., 2006). SRN is 1500 m in length and 7 m in the
mean water depth, characterized by two necks with a width of
about 70 m at Sakonnet River Bridge (SRB) and 120 m at Stone
Bridge (SB), respectively. The fact that FVCOM succeed in capturing
the sharp jump of the tidal elevation in this channel demonstrates
that geometric flexibility of FVCOM makes it practical for applications
to the near shore region characterized with complex coastal
geometry.

Animation of the sea level and near-surface tidal currents
in the Mt. Hope Bay. This animation was made using the coarse
resolution model results. To make the current field viewable,
the grids are re-sampled and only parts of currents points are
selected. Clike here or the
image on the right to view the animation in the full-size.
|
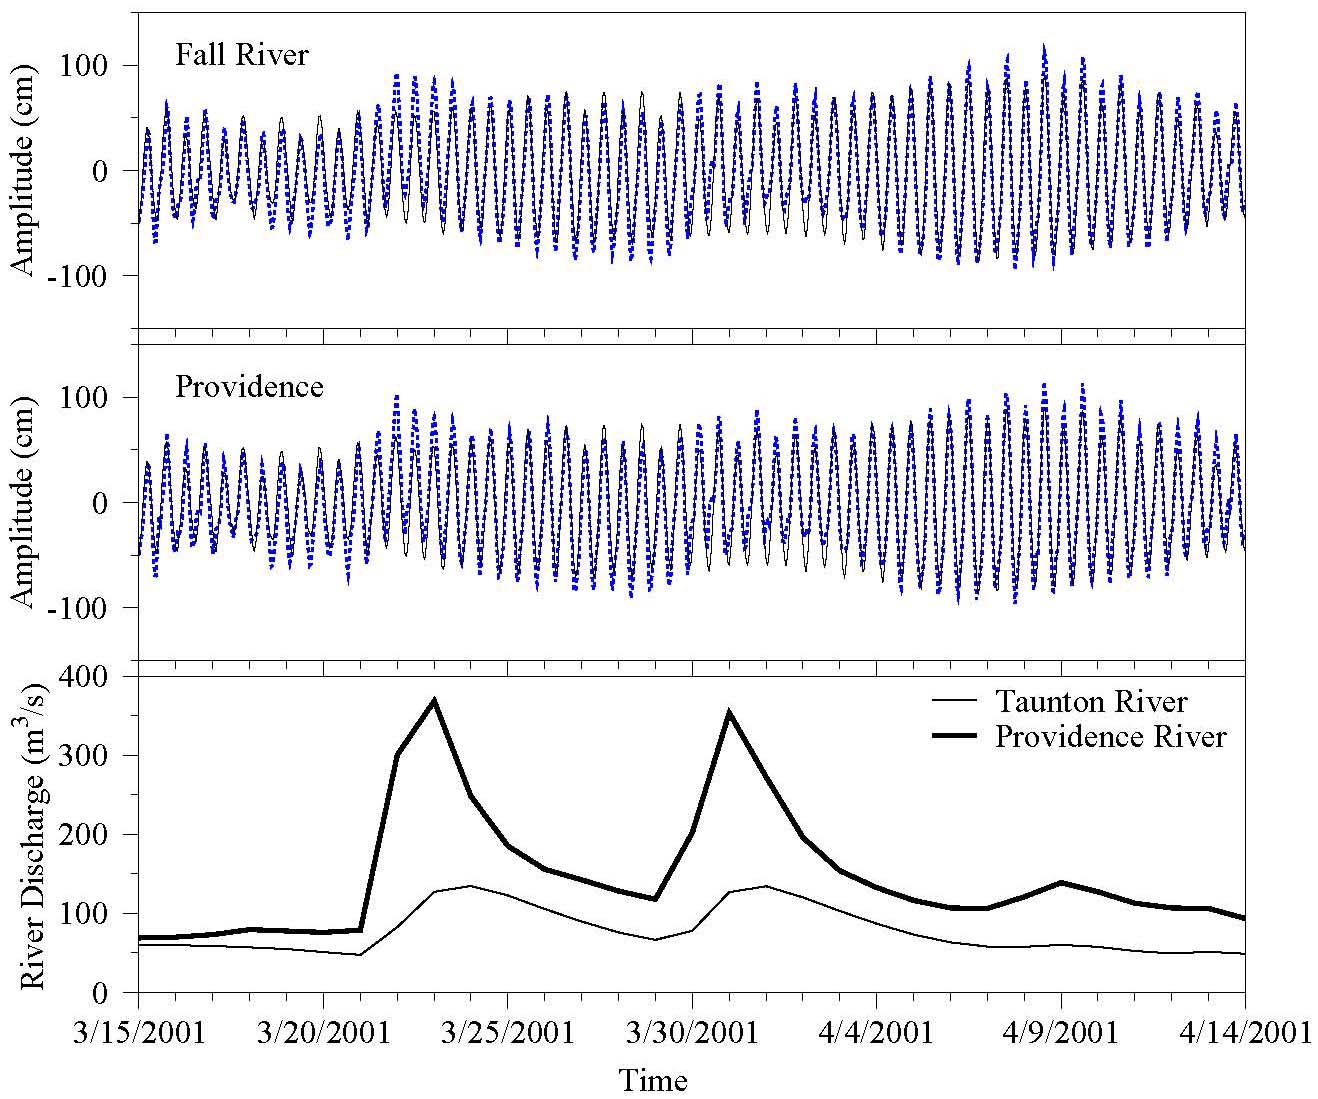
Forced by five tidal constituents (M2, N2, S2, O1
and K1), FVCOM also captures the spring and neap tidal
cycles in NB/MHB. An example was given for March-April
2001 in Zhao et al. (2006), which shows that the model
is sufficiently robust to reproduce the fortnightly and
monthly variation of tidal elevation measured at tidal
gauges(dash line with blue color). A slight difference
was found between observed and computed tidal elevations
during the period with a large river discharge.
This bias is a result of the sea level rise around the
time of peak river discharge, which was not taken into
account in tidal simulation.

|
| |
|