|
Nantucket Sound is a typical "flow through" coastal system, openning to the Gulf of Maine (GoM) to the east, Vineyard Sound (VS) to the west, and the inner new England Shelf to the south. The water is very shallow in the Sound, with a mean depth of ~9 m. The system can quickly transport solutes, particles, and organisms exported from Cape Code inlets, bays, and estuaries to adjoining "downstream" coastal water (e. g. VS and Buzzard Bay (BB)) while importing water and biota from "upstream" sources (e. g. Massachusetts Bay (MB) and western GoM into NS and Cape Cod inlets,bays and estuaries. NS is a shllow sound with strong tidal currents that help drive rapid (~1 month or less) exchange with adjacent coastal water. Tidal dynamics in this region is characterized by local coastal geometry, and failure to resolve th complex geometry can produce unrealistic tidal flushing in this transition area and will make it very difficult to study the impact of the region ocean (GoM) on the ecosystem in NS and downstream coastal waters.
|
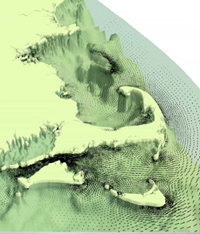
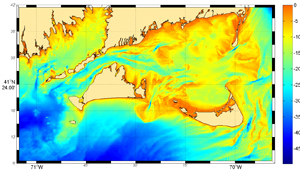 Bathymetric map of Nantucket Sound and surrounding waters. This figure was provided by Richard Limeburner at Woods Hole Oceanographic Institution. Bathymetric map of Nantucket Sound and surrounding waters. This figure was provided by Richard Limeburner at Woods Hole Oceanographic Institution.
Several long-term mooing sites were deployed by Limeburner and Beardsley at Woods Hole Oceanographic Institution (WHOI). The ferries were equiped to make the hydrographic and chlorophyll-a measurements by Gallagher at WHOI.
|
With MIT Sea Grant support, we have developed an integrated model system for the Massachusetts coastal region as a nested component in a Northeast Coastal Ocean Forecast System (NECOFS) being developed by the UMASSD-WHOI model development team (see figure on the right). The core of this model system is the Finite-Volume Coastal Ocean Model (FVCOM) developed by Chen et al. (2006a-b). The GoM/GB FVCOM features an unstructured grid in the horizontal and a terrain-following coordinate in the vertical. It is forced by tides at the open boundary, wind stress, heat flux, net precipitation minus evaporation at the surface, local runoff along the coast, and upstream flow at the Scotian shelf boundary. Surface forcing fields were originally computed using the NCAR/Penn. |
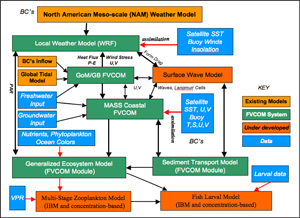
Schematic of the Mass Coastal FVCOM |
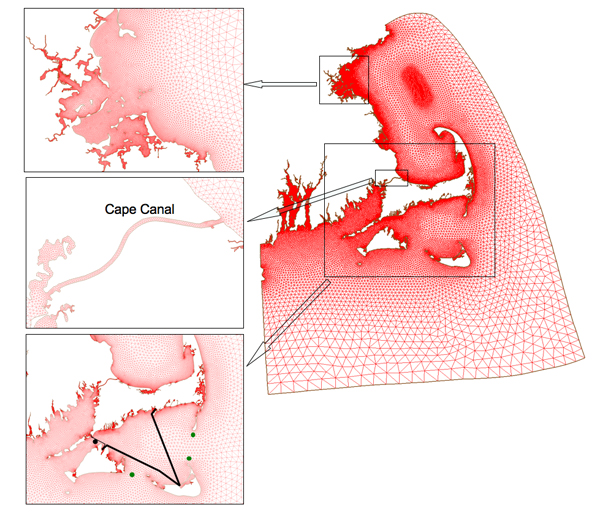
State mesoscale meteorological model (MM5) configured for the region (Chen et al. 2005), and now we use the next-generation NCAR/NOAA Weather Research and Forecast (WRF) model with horizontal resolution of 3 km in the MASS Coastal FVCOM domain.The MASS Coastal FVCOM is driven by the same atmospheric forcing and river runoff as GoM/GB FVCOM. The forcing and hydrographic conditions on the MASS Coastal FVCOM boundaries are provided by the GoM/GB FVCOM (via one-way nesting). The MASS Coastal FVCOM domain covers Mass and Cape Cod Bays, the waters surrounding Cape Cod, Nantucket and Martha’s Vineyard, Buzzard Bay and Narragansett Bay (see figure below), with a horizontal resolution varying from 10 m in estuaries to 1 km over the outer shelf. This grid includes many smaller coastal features that are omitted in the basic GoM/GB FVCOM grid for this area.
|
| Examples of Model Results for Demo Demonstration |
The animations shown below were made by the early version of the GoM FVCOM with coarse resolution in the Nantucket Sound. We will update these animation using the model output from the Mass Coastal FVCOM (the grid shown above) soon. |
1.Tidal Flushing-a result from the first generation GoM/GB FVCOM
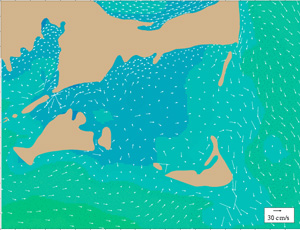
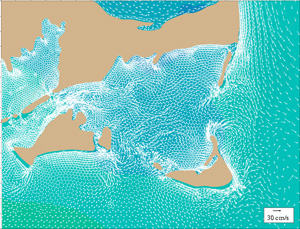
This animation was made based on the first generation GoM FVCOM model in 2003. While some details of coastal geometry were not included, this animation clearly shows the strong flushing and eddy shedding around the islands. In this animation, the only M2 (semi-diurnal) tidal currents were considered.
We have updated the Nantucket Sound grid in our second generation GoM FVCOM. Tidal current distribution is much more complex than the one shown here. It has no argument that we need the unstructurd grid model to resolve the reality in the Nantucket Sound and Massachusetts coast.
Click here or image on the right to view the enlarged flash movie.
|
Click here or image to view the enlarged flash movie.
|
The First-Generation Model Results
Click here or image on the right will bring you into a page on which you can make a selection to view the animation of the 40-hour low-passed filtered subtidal currents and water temperature over a yearly scale. The animations included in this page are from 1995 (an initial spin up year) to 2007, with the continous upload until present.
To make the animation viewable on a size-limited screen, the animation was made by re-sampled points.
|
Click here or images to view the animation for 1995 to 2007
|
The Second-Generation Model Results
Click here or image on the right will bring you into a page on which you can make a selection to view the animation of the 40-hour low-passed filtered subtidal currents and water temperature over a yearly scale. The animations included in this page are for selected years in 1995 (an initial spin up year)-present.
To make the animation viewable on a size-limited screen, the animation was made by re-sampled points.
|
Click here or images to view the animation for 1995 to 2007 |
The Third-Generation Model Results
The third-generated model is driven by the nested condition produced from the 3rd generation GoM/GB/NES model at open boundaries and the meteorological forcing produced by the WRF model with a horizontal resolution of 3 km. This high resolution model really improve the simulation in the near-coastal region and around islands and inside inlets, rivers, and bays.
Click here to view the animation of the M2 tidal currents and elevation over tidal cycles. We will upload the hourly field of the model hindcast currents, water temperatre and salinity on this page soon. To get an updated information, please contact Dr. Chen at SMAST.
|
 |
Reanalysis of Atmospheric and Ocean Conditions for the Lady of Grace Event and a Model System for Vessel Icing in the South Coast
January 26, 2007 was a day with sad news that the New Bedford fishing vessel Lady of Grace sank in Nantucket Sound. The U.S. Coast Guard has said that the captain had reported severe icing problems shortly before sinking and thus the likely scenario for the demise of the ship is that the vessel stability was compromised due to the change in center of gravity stemming from heavy ice accretion. The last communication between the Lady of Grace and the fishing vessel Lisa Ann II was at 10:00 PM EST, when the Lady of Grace was located about 12 miles south of Hyannis in Nantucket Sound. The Coast Guard started searching at about 5:06 AM EST on January 27. The sunken vessel was eventually found near Cross Rip Shoal, near an area where an oil sheen appeared on the surface on January 28, about two days after the Lady of Grace was reported missing.
After the event, we did this analysis and found that our model system should be able to predict the vessel-icing that can be used to the fisheries industry safety appliction in the Mass coast.
Clike here or image on the right to read our re-analysis results. |

Distribution of the predictor rate (PR) for icing over Nantucket Sound at 10:00 PM January 26, 2007 for a condition where the boat did not move. The star indicated where the boat sank.
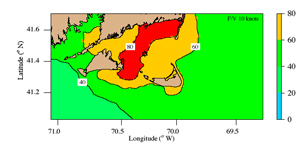
Distribution of the predictor rate (PR) for icing over Nantucket Sound at 10:00 PM January 26, 2007 for a condition where the boat move against the wind at a speed of 10 knots. |
|