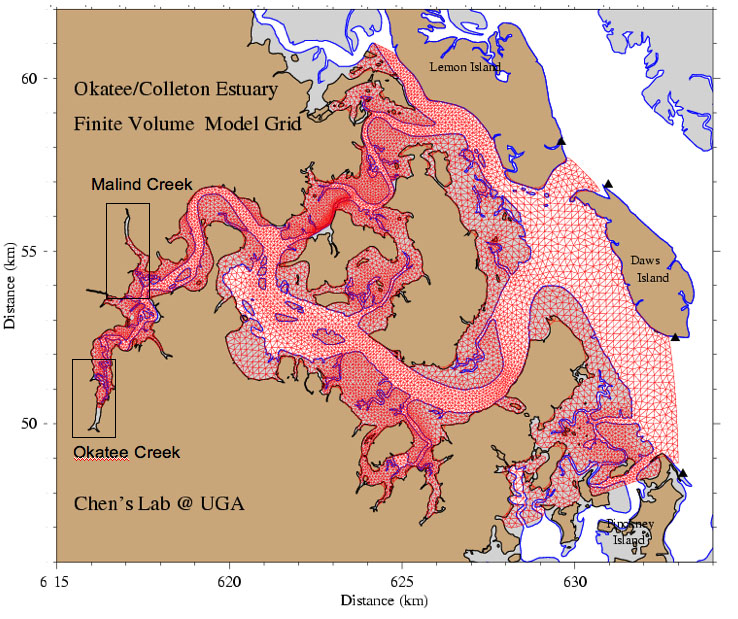
OKATEE CREEK and MALIND CREEK
The Okatee Creek is located at the head of the Okatte River and the Malind Creek is the northern side of the Okatee River. The Okatee Creek is a continuous part of the river flow channel, while the Malind Creek is a water flow-by system. Both creeks Both creeks are characterized with tidal flushing and strong asummetry of tidal currents over tidal cycles. They allo connect to the intensive salt marsh areas.
Significant difference was report in DO distributions in these creeks. The modeling experiments were made in these two creeks to examine how physical water exchange processes over marsh-creek complex affects the distribution of DO. The model results have been written into two papers.
|

Click here or image to view the full-size figure. |
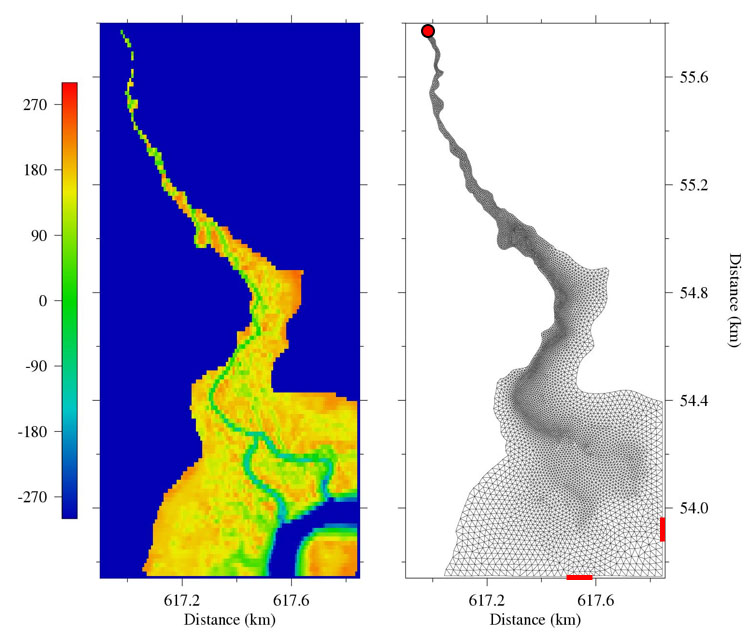
THE OKATEE CREEK MODEL:
The model resolution varied from 5 m to 20 m. Total 7 sigma levels were selected in the vertical. The red boundary shown at the top of the grid on the right figure was the open boundary that was connected to the Okatee River. The red dot at the down end of the creek is the site where the freshwater was injected. The bathymetry used in the model was interpolated from the remote-sensing derived 1x1 m hypsometric data measured by Dr. Jack Blanton and his collaborators.
The model was driven by tidal forcing (M2, N2, S2, O1, and K1 as well as M4) at the open boundary.
|

Click here or image to view the full-size figure. |
THE MALIND CREEK MODEL:
Similar to the Okatee Creek model, the Malind Creek model resolution also varied from 5 m to 20 m. Total 7 sigma levels were selected in the vertical. Unlike the Okatee Creek, the Malind Creek is located on the side of the Okatee River. The water transport onto this creek is mainly from the tidal flushing process flooded from the deep river channel. Two red lines shown in the lower boundary of the grid were the open boundaries with periodically water flow in and out. The red dot at the top end of the grid was the site where freshwater was injected.
The model was driven by tidal forcing (M2, N2, S2, O1, and K1 as well as M4) at the open boundary.
|

Click here or image to view the full-size figure.
|