|
THE OKATEE/COLLECTON RIVER FVCOM
|
|
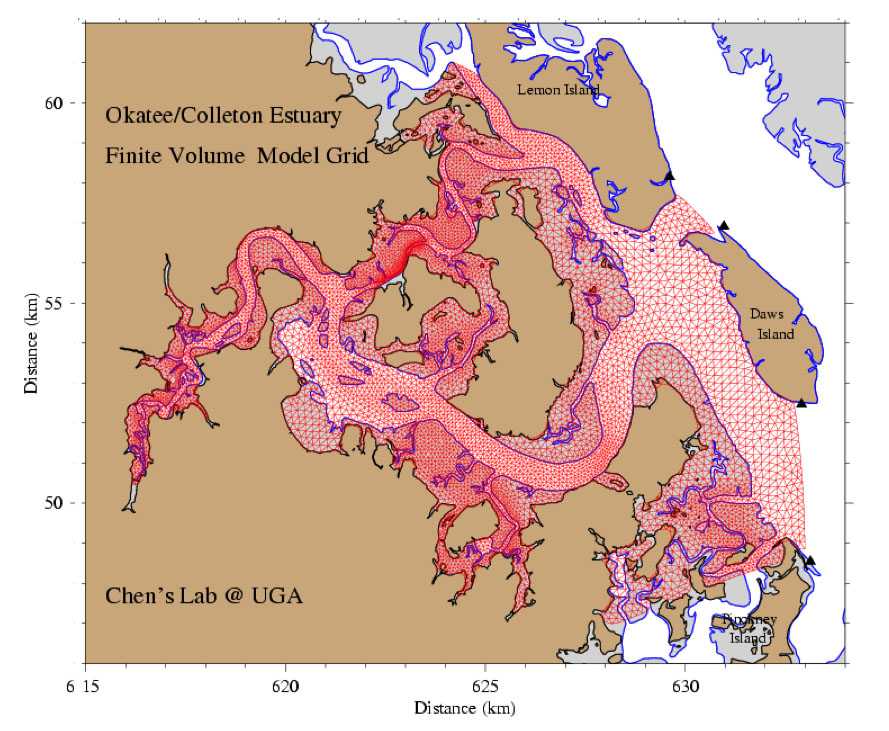
FVCOM Domain and Grid:
The Okatee/Colleton River Estuary model experiment was conducted in a computational domain shown on the right figure. This domain was configured by non-overlapped, unstructured triangular grids, with 2 open boundaries across the straits between Lemon and Daws Islands and between Daws Island and Colleton Neck.
Total mesh number was 14422, and the horizontal resolution ranged from about 250 m in the main channel of the estuary to about 25 m upstream of the Okatee/Colleton Rivers. A uniform sigma coordinate transformation with total 11 levels was used in the vertical, which corresponded to a vertical resolution of 1.5 m or less in the computational region. The time step was 1.242 sec for the external mode, with an integral value of 10 for the internal-external time step ratio.
|

Click here or image to view the full-size figure.
|
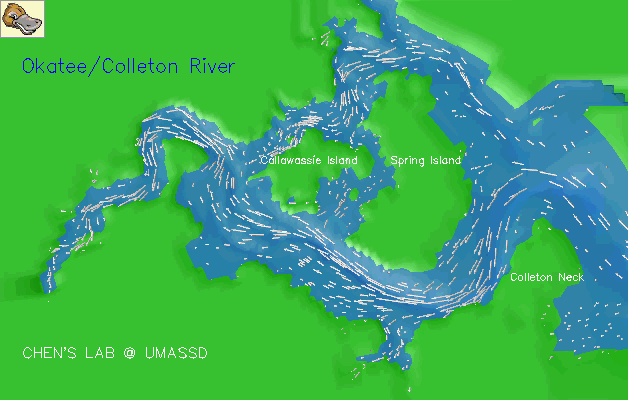
Model-Predicted Flooding/Drying Process
An animation showing the tidally driven flooding/drying process over the intertidal salt marsh in the Okatee/Colleton River Estuary.
Water was flooded into the river from two paths around Spring Island from the Broad River. At high water, most of the inter-tidal salt marsh area was covered by the water. In turn, water was drained back during the ebb period and constrained in the main channel at low water.
Click here or image to watch the large size animation.
|

|
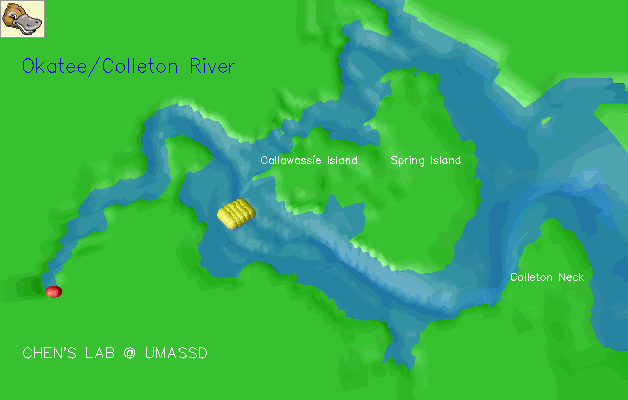
Near-Surface Particle Tracking
An animation showing the movement of particles released near the surface at the two sites: one is at the upstream end of the estuary and the other is in the Colleton River.The particles released in the upstream area of the Okatee River moved outward with periodic oscillations over tidal cycles but once they arrived in the Colleton River, the movement became chaotic.
Click here or image to watch the large size animation.
|

|
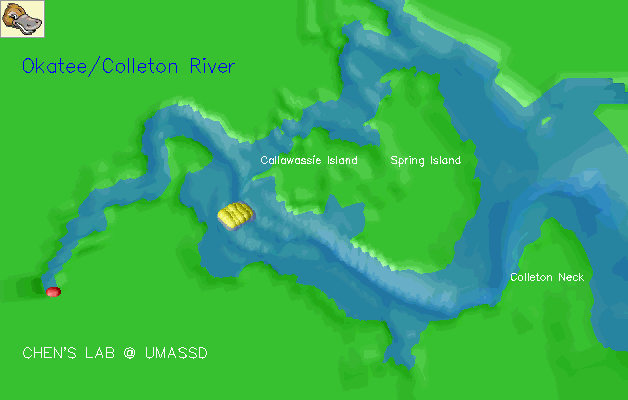
Mid-Depth Particle Tracking
An animation showing the movement of particles released at the mid-depth with the same locations shown above. The features detected from the near-surface particle tracking are still true at the mid-depth. Note that there was the verticla motion in the particle tracking. The word "mid-depth" referred to the the depth at the releasing site.
Click here or image to watch the large size animation. |

|
Near-Bottom Particle Tracking
An animation showing the movement of particles released near the bottom with the same locations shown above. The features detected from the near-surface and mid-depth particle tracking are still true near the bottom except the movement is relatively slow. Note that there was the verticla motion in the particle tracking. The word "near-bottom" referred to the the depth at the releasing site.
Click here or image to watch the large size animation. |

|
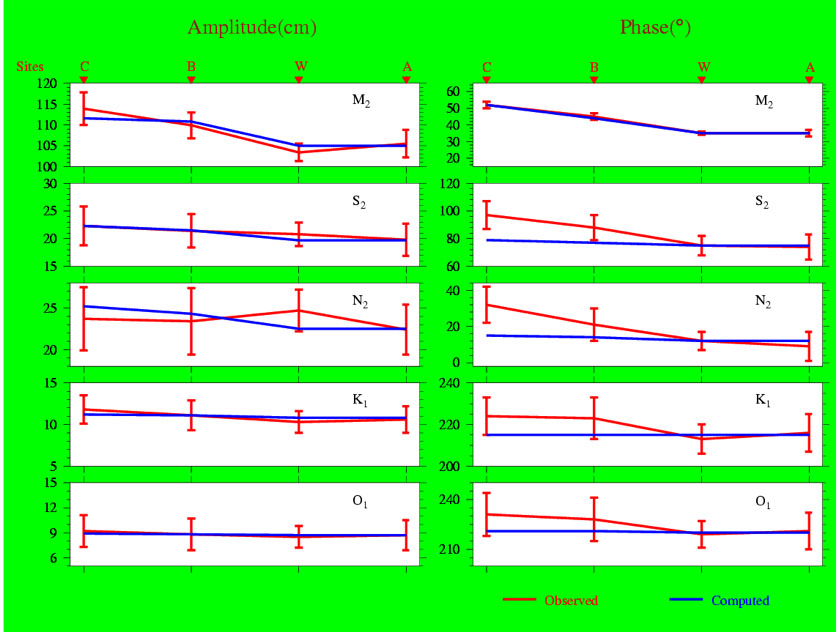
Model-predicted amplitudes and phases of these five major tidal elevations were directly compared with the observational data at three mooring sites (see the study site map for locations of measurement sites). Elevations were measured with Sea-Bird Electronics SEACAT and MicroCAT data loggers for a period from 28 February to 26 April, 2001.
FVCOM provided a reasonable tidal simulation. The model predicts that the M2 tide was dominant in the Okatee/Colleton River. The ratio of S2 or N2 to M2 is about 0.2 and K1 or O1 to M2 is about 0.1. The upstream and downstream difference range of ~10 cm in M2 and < 5 cm in S2 and K1 or O1. |

Click here or image to view the full-size figure.
|
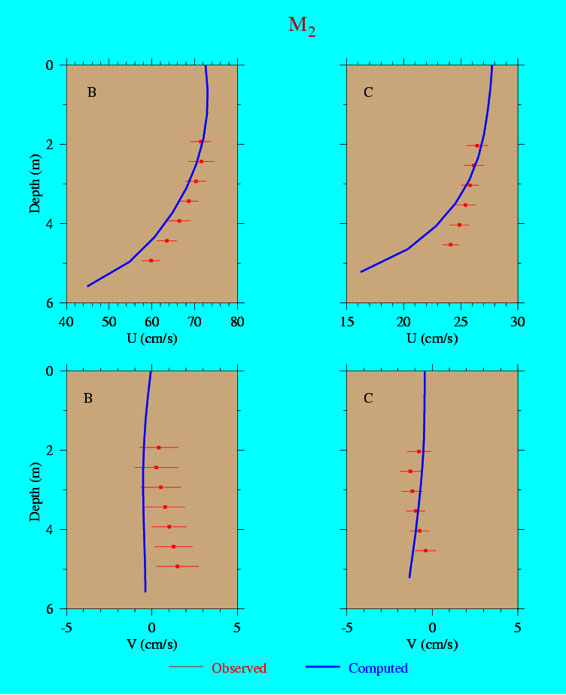
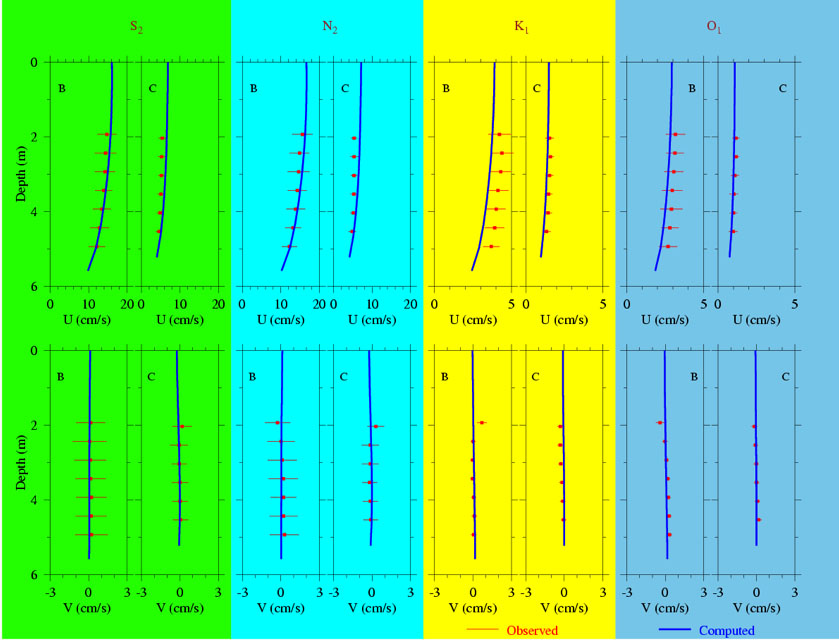
A detailed comparison between model-predicted and observed major axes, minor axes, orientations, and phases. Considering the uncertainty in current measurements, the model has done a pretty good job in resolving the vertical shear of the major axis of tidal currents at both sites B and C. A relative large error in the current phase was also believed due to poor resolving of bottom roughness in the mud characterized estuarine region.
|

M2 tide
|

S2, N2, K1 and O1 Tdes |
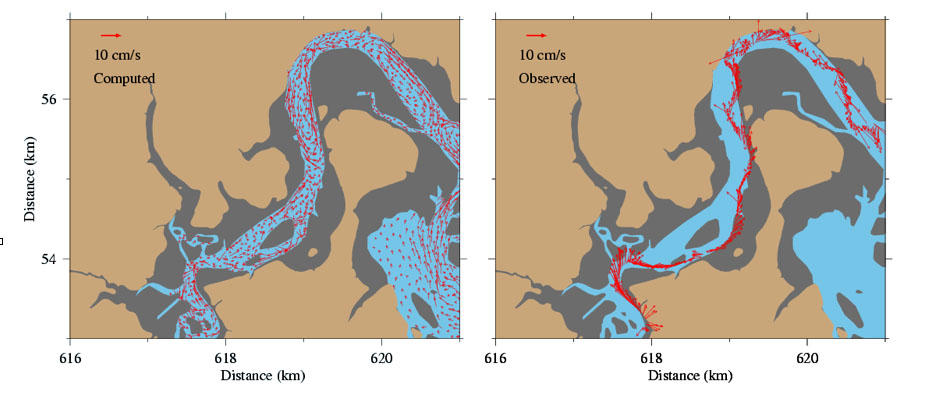
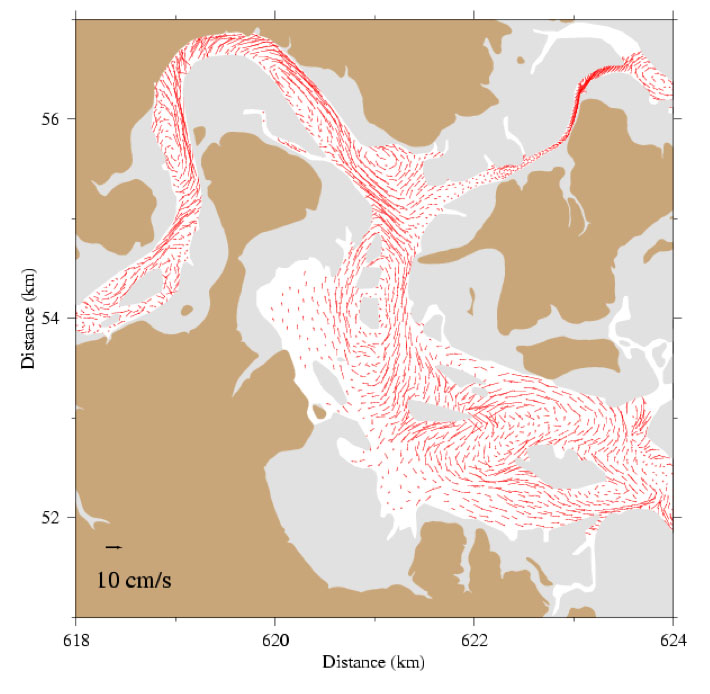
The model results clearly show that residual currents in the Okatee/Colleton River Estuary were characterized by multiple clockwise and anticlockwise eddy-like currents.
In spite of a relative large measurement error, the along-river distribution of the vessel-towed ADCP derived residual current reasonably detected this feature, consistent with model results.
|

Click here or image to view the full-size figure.
|
The model results clearly show that residual currents in the Okatee/Colleton River Estuary were characterized by multiple clockwise and anticlockwise eddy-like currents. In the main channel of the river where no islands or barriers exist, eddies are centered in the middle of the river and velocity increases towards the coast. In these area, the maximum speed of the velocity in a residual eddy reached 25 cm/s near the surface and about 15 cm/s near the bottom. In the Colleton River, where several islands and barriers are located, eddies are restricted in shape around geometry of islands and barriers, and the spatial structure of the residual currents were much more complex.
Eddy-dominant residual current fields dected from this study suggests that the estuarine dyanmics is much more complex than what we learned from the traditional estuarine textbook. |

Click here or image to view the full-size figure. |
|