|
Thermal Plume and Its Impacts
on Water Temperature
One of the challenges for the MHB modeling
is to simulate the Power Plant discharge induced thermal
plume. The temporal and spatial structures of this plume
were detected in the remote-sensing aircraft photos taken
in September 1998. The photos taken during one tidal cycle
clearly showed that the plume looked like a narrow jet
and varied significantly with tidal motion. Due to the
limitation in model horizontal resolution, the size of
this plume was over-predicted by previous modeling efforts.
For example, the plume water predicted by the Applied
Science Associate, Inc (ASA) curvilinear coordinate model
spread almost the entire MHB area, no jet structure was
resolved. As a result, the impact of this plume on the
heat increasing in MHB was exaggerated in their results.
|
|
The unstructured grid used in FVCOM allows
us to increase the horizontal resolution in the plume
region without significant modification of the boundary
forcing. An effort was made to use FVCOM to simulate the
Power Plant discharge induced plume and compared it with
the aircraft photos. Our experiments show that the size
of the thermal plume is sensitive to the model horizontal
resolution. When the horizontal resolution reaches 50
m, the model-predicted thermal plume is like the aircraft-observed
plume (see Fig. 1 for an example of the comparison during
the ebb tidal period and
click the picture will show the animation for a tidal
cycle), however the width of this plume
is still much larger than that observed in the high-resolution
CTD measurements made in August 2005.
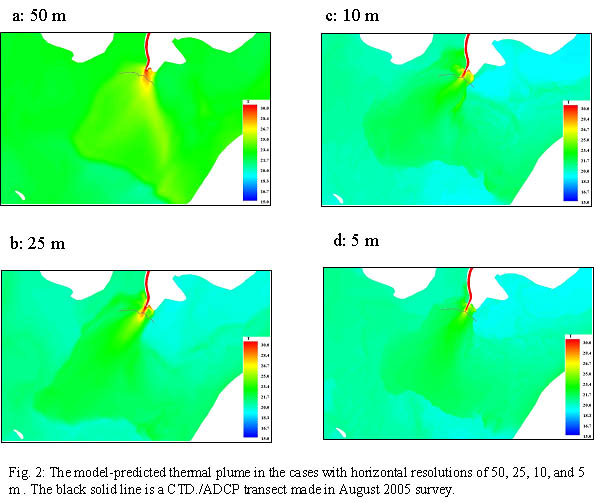
After the field measurement was made,
we conducted a model experiment to examine the sensitivity
of the model-simulated plume to the model resolution.
For the given same initial conditions of the water temperature
and salinity, the thermal flux from the Power Plant, and
tides, we ran FVCOM for four cases with horizontal resolutions
of 50, 25, 10 and 5 m in the plume regions. The experiment
was made for the August 2005 during which the field survey
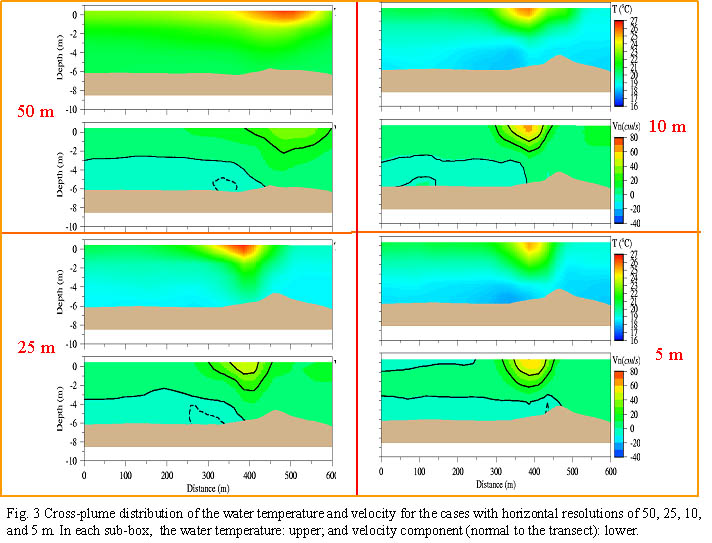
was conducted. The examples of the comparison results
are shown in Fig. 2 (horizontal) and Fig. 3 (vertical).
The comparison results show that the width of the thermal
plume becomes smaller as the horizontal resolution increases.
The numerical convergence is reached when the horizontal
resolution is up to 10 m or less. Although the model simulation
was made for the 2005 summer condition, the result should
apply for the other seasons and years. This suggests that
previous modeling results obtained from a model run with
a horizontal resolution of 200 m tends to exaggerate the
size of the thermal plume and its impact on the heat flux
in the bay.
|


The impact of the thermal plume on the water
temperature in MHB for August, hottest period of a year in this
year, was estimated by running the FVCOM for the cases with
and without inclusion of the thermal plume. For a case with
the horizontal resolution of 50 m, the model suggests that during
the summer season (a season during which the ocean gain heat
from atmosphere) the maximum value of the water temperature
increased due to the Power Plant thermal plume is about 0.7oC.
As we learned from the sensitivity analysis, the 50-m resolution
model tends to overestimate the size of the plume and thus underestimate
the vertical and lateral thermal dissipations. Taking these
factors into account, the water temperature increase resulted
from the thermal plume should be less than 0.7oC during the
summer. This value is much smaller than the model results shown
in previous low-resolution models.

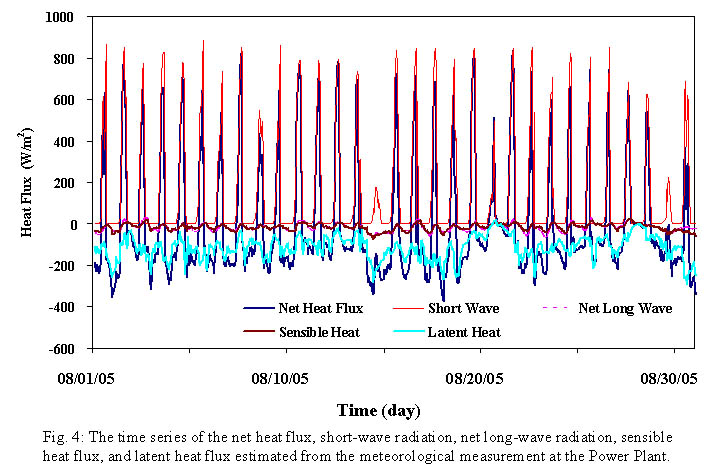
We also used the heat flux measurement data
recorded at the Power Plant to estimate the heat impact on the
water temperature increase in the MHB. In August 2005, the net
heat flux is -2.6 W/m2. This suggests that a significant heat
from the thermal plume water is fluxed into the air. Consider
an idealized case with no inclusion of the water exchange between
MHB and NB and also turbulent thermal dissipation, we can easily
estimate the maximum water temperature increase by

and the result shows that

It should be noted here that the estimation
was made for an idealized case with no inclusion of the thermal
dissipation and the heat exchange between MHB and NB. Considering
all these factors, the maximum heat impact of the thermal plume
during the summer time must be less than 0.75oC. This also suggests
that the water temperature increase due to this thermal plume
in the other month should be significantly less than this value,
especially during winter-spring in which the ocean tends to
loss the heat to atmosphere |