|
THE SOUTH CHINA SEA: AN UNSTRUCTURED GRID MODEL (FVCOM)
|
|
The South China Sea (SCS) in a range of 98° to 123° E and 0° to 26° N is a typical marginal sea characterized with the deep basin, shelf break, and shallow shelf. The deep basin is roughly elliptical in plane view with a major axis in the southwest-northeast direction. The Chinese Shelf occupies the area running southwestward from Taiwan Strait to the Gulf of Tonkin and connects to the Sunda Shelf and Gulf of Thailand in the south through a narrow steep slope around the Vietnam coast. Unlike other marginal seas, in the SCS the area of the shelf is larger than the area of the basin and their ratio is about 1.2. This geometric feature implies that the SCS is an active coastal-basin interaction region and it can not be studied without inclusion of coastal processes.
|

A 3-D view of the SCS bathymetry. The database was downloaded from DBDB-5 with correction in the coastal regions from mutli data sources. Since the SCS basin is deeper than 4000 m, so in this image the continental shelf with a water deptyh of <100 m was invisible with red color.
|
Major water source of the SCS come from rivers (particularly the Pearl River at the northeastern coast) and 5 major straits connected to the open Pacific Ocean. An effort has been made by scientists at UMASSD and WHOI to 1) construct a high-resolution monthly climatologica hydrographic database and 2) apply FVCOM to study the basin-shelf interaction process.
FVCOM has been successfully developed for the SCS, with accurate simulation of major tidal waves and wind- and buoyancy-driven currents. In particularly, this high-resolution model has challenged previous model results accomplished in this region. Our findings were written into several papers. Since all results have not been published yet, please contact Dr. Chen for details if you are interested in learning what have been accomplished. Here we provides some information about 1) our previous field measurement results, 2) monthly climatology of water temperatue and salinity, 3) FVCOM domains and an example of the tidal animation. All stratified results will be posted after our papers are published.
By collaborating with Chinese scientists, we also analyzed 37 years of the current meter data taken in the SCS, and found that there is a year-round westward subtidal flow through Qiongzhou Strait. This result questions all previous SCS models, because these models fail to resolve this realistic current pattern. See a publication by Shi et al. (2002).
|
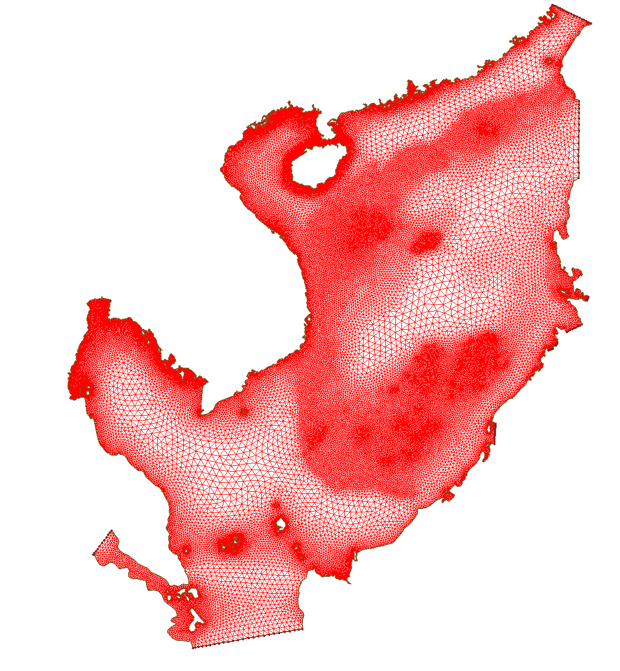
First Generation SCS FVCOM
The SCS FVCOM was set up 3 years ago, with horizontal resolutions of 300 m near the coast and around islands, 1 km over the slope and 3-10 km in the interior. The model uses the sigma-coordinate in the vertical, with total 41 non-uniform layers to provide the better resolution near the surface. The model was driven by tidal forcing at open boundaries, winds and heat fluxes. Monthly climatological water temperature and salinity fields were used for the model inialization. This model successfully simulated the tidal motion and also buoyancy-and wind-driven circulation.
Click here or image to view a larger size of the figure. |
 |
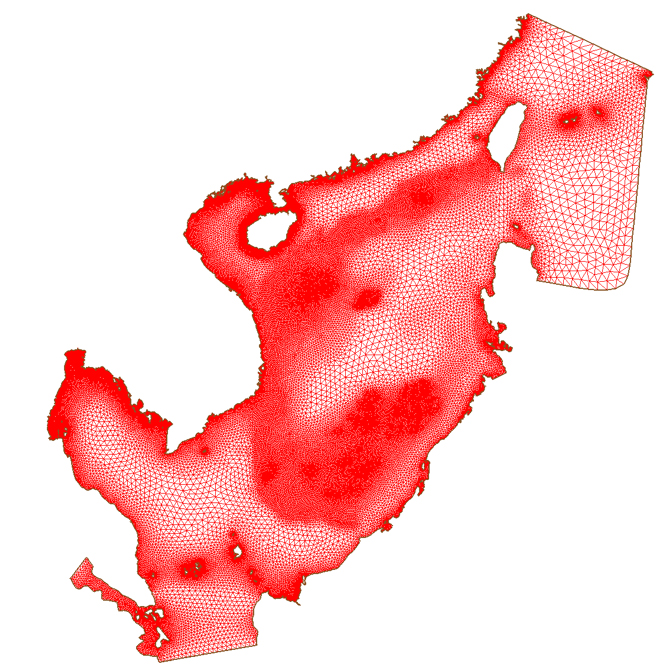
Modified Version of the SCS FVCOM
We have extended our SCS FVCOM to cover the Kurioshio area east of Taiwan for the study of the intrusion of the Kurioshio Water into the SCS. The modified grid is shown in the image on the right side. This version also upgraded into the generalized terrian-following coordinate in the vertical, with the uniform-thickness layers near the surface and bottom to better resolve the surface and bottom boundary layers. We have used this model to study 1) current separation on the western coast, 2) eddy formation on the slope and around islands, 3) the island roles of Hainan and 4) complex current structures around Taiwan Strait. A NH-hydrostatic FVCOM is being developed and implemented into this version to study the solitary waves on the slope.
Click here or image to view a larger size of the figure. |
 |
Tidal Animation
The model was run with 5 major tidal constituents. Here is an examaple of the M2 tidal elevation and near-surface current. To get the tidal current correctly, the model must be run with all tidal constituents together.
Click here or image to watch a flash movie. |
 |
Monthly Climatology of Water Temperature
A slide show for the near-surface distribution of the water temperature in the SCS. Slides were plotted using our SCS climatology hydrographic database, which includes all hydrographic data since 1817. An objective mapping program with different coherence scales in along- and cross-slope directions were used to provide a better resolving of the cross-shelf structure. Differences from other databases, a rich dataset over the shelf was added, so it provides a much better resolution over the coastal region.
Click here or image to watch a flash slide show. |
 |
Monthly Climatology of Water Salinity
A slide show for the near-surface distribution of the water salinity in the SCS. Slides were plotted using the same database for the water temperature presented above. An objective mapping program with different coherence scales in along- and cross-slope directions were used to provide a better resolving of the cross-shelf structure. Differences from other databases, a rich dataset over the shelf was added, so it provides a much better resolution over the coastal region.
Click here or image to watch a flash slide show. |
 |
Monthly Climatology of Water Temperature and Salinity on A Cross-Shelf Transect
A slide show for the cross-shelf distribution of the water temperature and salinity on a straightline transect cut from the coast near the Pearl River to the interior of SCS. Slides clearly show two frontal systems over the continental shelf. The data used to make this plot were constructed from 46 standard levels. Because the interior of SCS is deeper than 4000 m, the figures were only drawn for the upper 300 m in order to provide a clear view of the hydrographic structures over the shelf.
This database provides a unique opportunity to examine the baroclinic effects on the SCS circulation, particularly on the seasonal variation. These data have been used in the SCS FVCOM experiments. To learn more about these experiments, please contact Dr. Chen at SMAST/UMASSD.
Click here or image to watch a flash slide show. |
 |
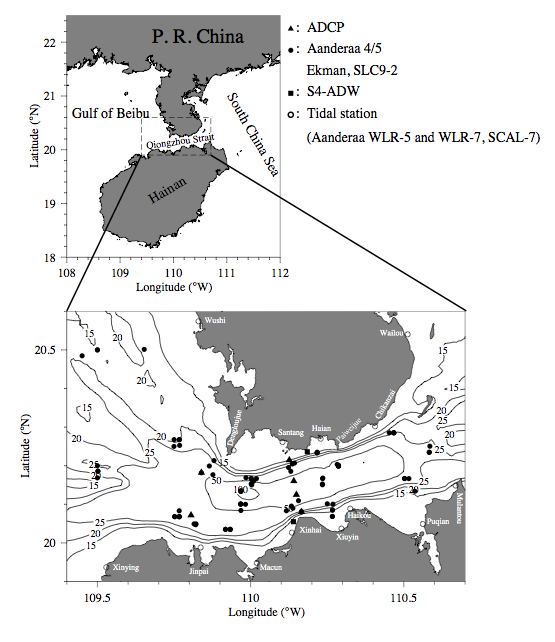
The Qiongzhou Strait Field Measurements
Tidal stations with either 30 yeas or one-year records: Xinying, Macun, Xinhai, Xiuyin, Santang, Haian, Sushi, Wailou, Jinpai, Puqian, Paiweijue, and Dengloujue. ALL filled triangles and dots are locations of current meters. Five types of current meters [(ADCP), S4-ADW, Aanderaa, SLC9-2, Ekman] were deployed at mooring sites in Qiongzhou Strait and the Gulf of Beibu. Instruments were deployed at standard levels of 0–3, 5, 10, 15, 30 m and near the bottom. Current data (speed and direction) were collected at these sites with a time interval of 15 min, 30 min, or 1 h over short-term (25 hours to 15 days) and long-term (month to year) periods at various times from 1963 to 1999.
Click here or image to view a big size figure.
|
 |
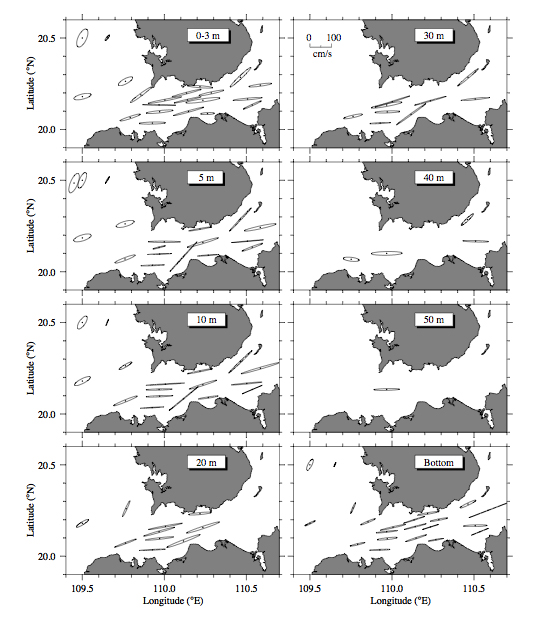
TidaL Current Ellipses
Tidal ellipses of the diurnal tidal current [an average of (O1 + K1)/2] at selected depths of 0–3, 5, 10, 20, 30, 40, and 50 m and near the bottom (3 m above the bottom).
The diurnal tidal ellipses are oriented approximately parallel to the local topography, with their major axes along the strait. The diurnal tidal currents have their maximum amplitudes subsurface between 5 and 10 m, where the amplitude of the major axis varies in a range from about 30 cm /s in the western entrance connecting to the Gulf of Beibu to about 100 cm s/ in the eastern region of the strait. Even at a depth close to the bottom (3 m above the bottom), the amplitude of the diurnal tidal currents reaches 30–50 cm/s.
Click here or image to view a large size of figure. |
 |
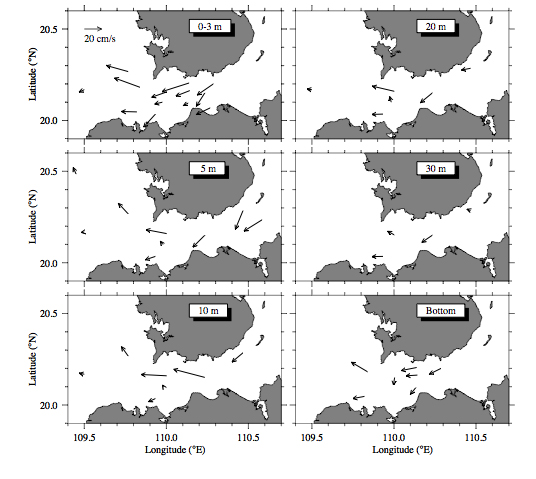
Wintertime Averaged Subtidal Currents
The synthetic analysis of all current data available
over the last 37 years shows that there is a year-round westward mean flow in Qiongzhou Strait.
The current is stronger in the upper 10 m, relatively weak at middepth, and significant near the bottom, with a maximum speed of about 20–40 cm /s in winter. The wintertime current pattern observed in Qiongzhou Strait is the same as that suggested by previous investigators based on the wind-induced circulation in the SCS, because it is mostly driven by the wind.
Click here or image to view a large size of figure.
|
 |
Summertime Averaged Subtidal Currents
During summer, Qiongzhou Strait is still featured by a westward mean current. The current is stronger in the upper 10 m, relatively weak at middepth, and significant near the bottom, with a maximum speed is about 10–30 cm/s in summer and autumn. The mean transport of the outflow from Qiongzhou Strait to the Gulf of Beibu is estimated on a cross-strait transect with an average width of 29.5 km and an average depth of 46 m. Considering the current speed of 10–30 cm/s at the surface and 5–10 c/s at the bottom in summer through autumn, the mean transport of the outflow 0.1–0.2 Sv in summer through autumn.
Click here or image to view a large size of figure. |
 |
|