|
 |
MODELING OF LAKE MICHIGAN ECOSYSTEM
|
As one component of NSF/NOAA-funded Episodic Events Great Lake Experiments (EEGLE), we have been working on modeling the ecosystem in Lake Michigan. The objective of our efforts is to test the primary hypothesis that the effects of episodic meteorological events on biological productivity and chemical transformation are mainly through the modification of (1) the cross-margin and vertical transports of momentum, solutes, particulates, and organisms, (2) turbulent mixing, and (3) light limitation.
A collaborative model team was formed, which including Dr. Schwab and Dr. Beletsky (physical model group), Dr. Bundy, Dr. Cotner, Dr. Eadie, Dr. Fahanenstial, Dr. Gardner, and Dr. Lavrentyev (biological observational group) and Dr. Chen and his students at University of Georgia (now at University of Massachusetts-Dartmouth).
|

This image was downloaded from the EGGLE program website.
|
A lower trophic level biological model was implemented into a full three-dimensional hydrodynamic model (a modified version of Princeton Ocean Model-POM with application to Lake Michigan). This coupled model was used to examine the influences of surface wind stress, heat flux and sediment suspension on the suspended plume-related local ecosystem. The major accomplishment of this work is to build a bridge between physical oceanographers and biologists. The interdisciplinary collaboration was a key factor to make this project success and productive. The ecosystem in Lake Michigan is much more complex than we thought. Since it involves in multi-scale process interactions, we did not expect that we can simulate the lower trophic food web system using the modeling technique available during that time. This was one of the reasons we focused our study on process-oriented numerical experiments.
This website was designed to given a brief summary of our modeling accomplishments. Most of our work have been published, so please read our papers if you want to know the details. |
An Eight-Component Lower Trophic Food Web Model
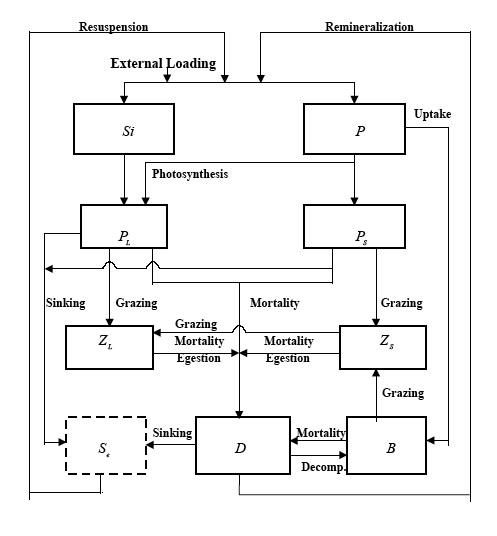
The biological model is based on the observed features of the lower trophic level food web in Lake Michigan (Scavia and Fahnenstiel, 1987). It is a phosphorus-controlled model with eight independent variables: two nutrients (Phosphorus and silicon), two phytoplankton (diatom and flagellates), two zooplankton (copepod/cladocera and microzooplankton), bacteria and detritus(see the figure on the right).
A detailed description of this model was given in Chen et al. (2002). The strategies used to develop this lower trophic level food web model are: 1) as simple as possible; 2) reslove the two distinct seasonal phase patterns in phytoplanton, 3) include the microbal loop which was a dominant process in the sediment suspended plume.
|

Click here or image to view the full-size image |
The 1-D Experiments
Driven by observed meteorological forcings, a 1-D coupled biological and physical model experiment showed a controlling of physical processes on the seasonal variation of biological variables in Lake Michigan: diatoms grew significantly in the subsurface region in early summer as stratification developed and then decayed rapidly in the surface mixed layer when silicate supplied from the deep stratified region was reduced as a result of the formation of the thermocline. The non-diatoms subsequently grew in mid and late summer under a limited-phosphate environment and then declined in the fall and winter as a result of the nutrient consumption in the upper eutrophic layer, limitation of nutrients supplied from the deep region, and meteorological cooling and wind mixing. The physical model used in this experiment is POM that was configured and run by Dr. Schwab and his co-workers.
Click here or title or image on the right to go to 1-D experiment web page where some results are presented. The results were published in Chen et. al. (2002).
|

Click here or image to go to the 1-D experiment web page. |
The 3-D Experiments
The impact of a reflective, recurrent coastal resuspension plume on the lower trophic food web system in Lake Michigan was examined. Numerical experiments were conducted for the March 1998 and 1999 plume events. The comparison between modeling results of these two years shows that the spatial distributions of the biological fields were closely coupled to the physical environment associated with wind-driven 3-D circulation and mixing. The influence of suspended sediment plumes on the lake ecosystem was reflected in heterotrophic (secondary) production rather than autotrophic (primary) production. Comparisons between energy fluxes among biological variables suggest that the microbial loop (detritus, bacteria and micro-zooplankton) played an important role in the ecosystem dynamics during plume events.
Click here or title or image on the right to go to the 3-D experiment web page.
|

|
A New Unstructured Grid Lake Michigan Model (Lake-Michigan FVCOM)
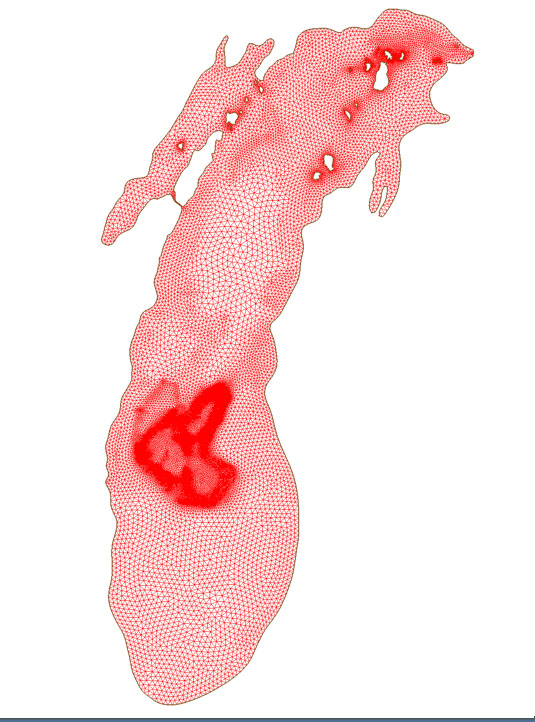
Our previous modeling experiment with POM indicates its limitation in resolving the near-shore process and also steep bottom topography "seamounts" and islands in Lake Michigan. It is straightforward to upgrade the current POM-based Lake Michigan physical model to an unstructured grid finite-volume FVCOM, as just like we did in Lake Superior.
The new Lake Michigan FVCOM is developed to provide a better resolving of the complex coupled biological-physical procress over the "seamount" in southern Lake Michigan. This model is configured with the unstructured triangular grid in the horizontal and generalized terrian-following coordinates in the vertical. Horizontal resolution varies from 500 m to 2 km. The 31 vertical layers are specified, with 10 uniform layers respectively in the surface and bottom boundary layers. An effort is proposed to compare this new model with the existing POM in Lake Michigan by using the same meteorological forcing.
Click here or image on the right to view the full-size image of the model grid. |

|
|